Foot Locker (FL stock) kicks it through the uprights on FQ3 earnings
- Foot Locker stock has advanced more than 14% in Friday's premarket.
- FL shares were stuck between $30 and $34 for a month and a half.
- Foot Locker beat analyst expectations on the top and bottom lines and guided higher.

Foot Locker (FL) stock sailed 14.1% higher to $37.65 in Friday's premarket after the shoe outlet posted third-quarter earnings and guidance that outdid most bullish analysts. Foot Locker posted $1.27 in adjusted earnings per share (EPS) on revenue of $2.17 billion. This was well ahead of Wall Street consensus for the quarter – $1.11 in adjusted EPS on sales of $2.09 billion.
Foot Locker earnings news
Alongside the sizable beat on both top and bottom lines, Foot Locker management said same-store sales rose 0.8%, while analysts had expected a 6% decline. This surprise has been a major part of the Friday morning surge in the share price.
In fact, analysts had expected full-year same-store sales in fiscal 2022 to fall between 8% and 9%. Instead, management said same-store sales will drop just 4% to 5%. Net revenue is also unlikely to fare as badly as both analysts and management had feared earlier in the year. Management also raised full-year EPS guidance from a midpoint of $4.35 to a midpoint of $4.46.
Results for the quarter were down from a year ago when the footwear chain produced adjusted EPS of $1.93 on revenue of $2.19 billion.
Foot Locker just opened a $40 million distribution center in Reno, Nevada that it said would help it store and move as much as 20 million product units at a time. The 465,000-square-foot warehouse will enable Foot Locker to source products for as many as 300 stores.
Foot Locker stock forecast
Foot Locker stock has broken out of the $30 to $34 consolidation zone that has been the norm since late September. Now bulls will focus on breaking through resistance at $40, which stood tall as fierce resistance from late August to late September. Beyond here sits further resistance between $45 and $46 from all the way back in January. One piece of evidence that this rally may have legs is that the Moving Average Convergence Divergence (MACD) indicator has crossed over in a bullish stance and is currently approaching the zero threshold. Moving above the zero threshold is typically a signal that a rally has momentum.
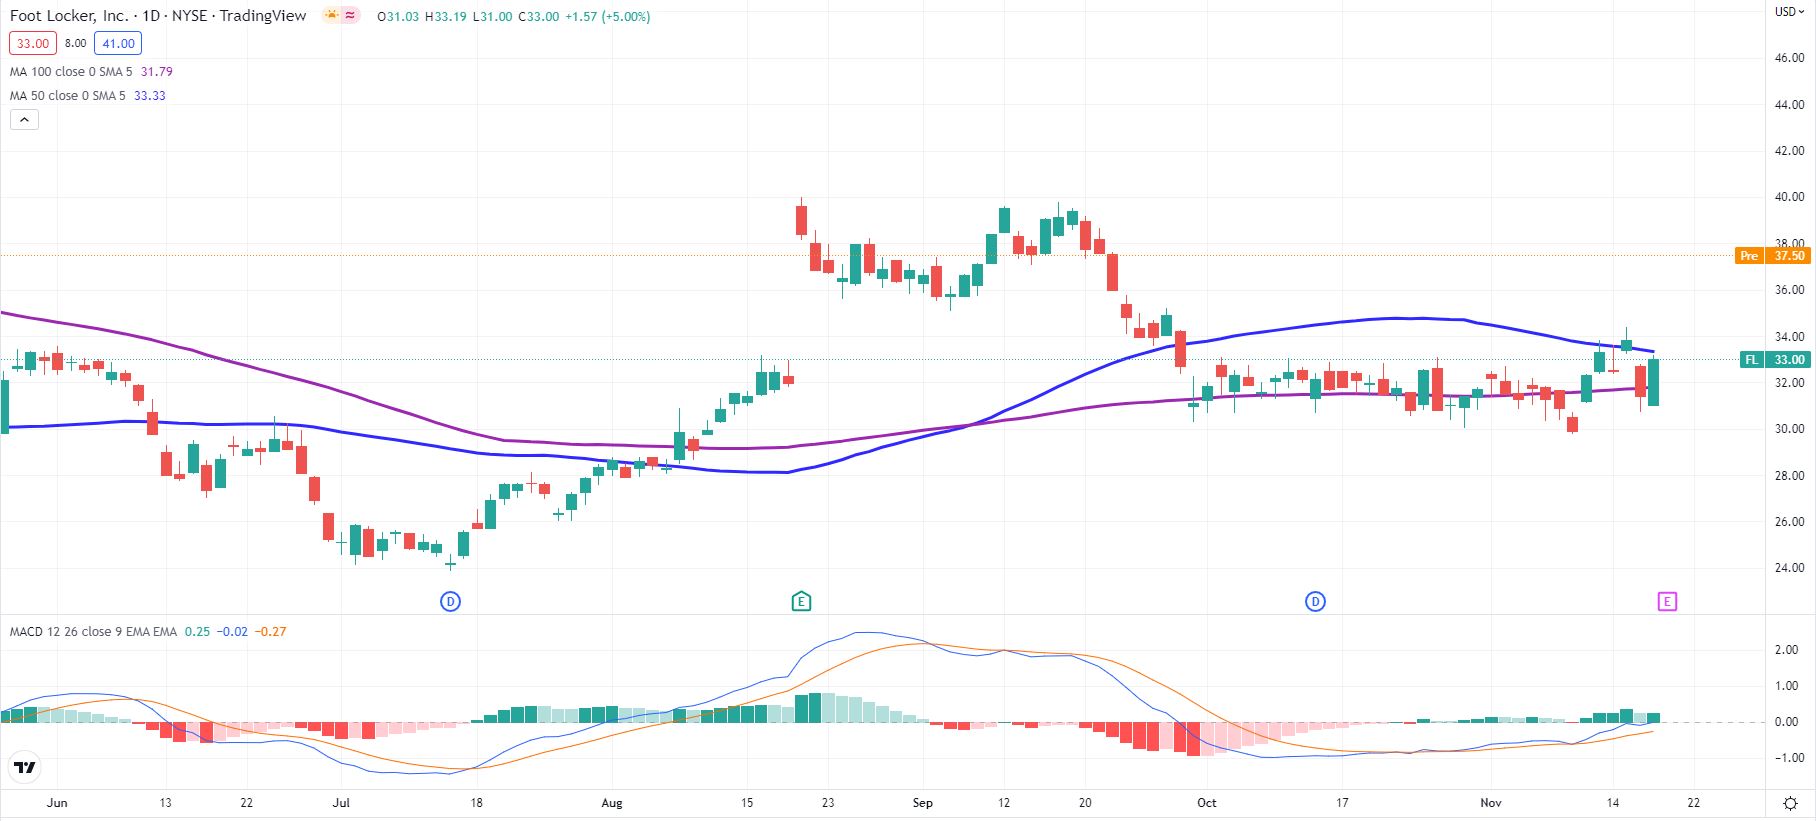
FL stock 1-day chart
Author

Clay Webster
FXStreet
Clay Webster grew up in the US outside Buffalo, New York and Lancaster, Pennsylvania. He began investing after college following the 2008 financial crisis.