|

EURJPY Price Analysis: Reclaims 145.00 after diving below the 50-DMA

  • EURJPY reclaims the 145.00 figure on risk aversion.
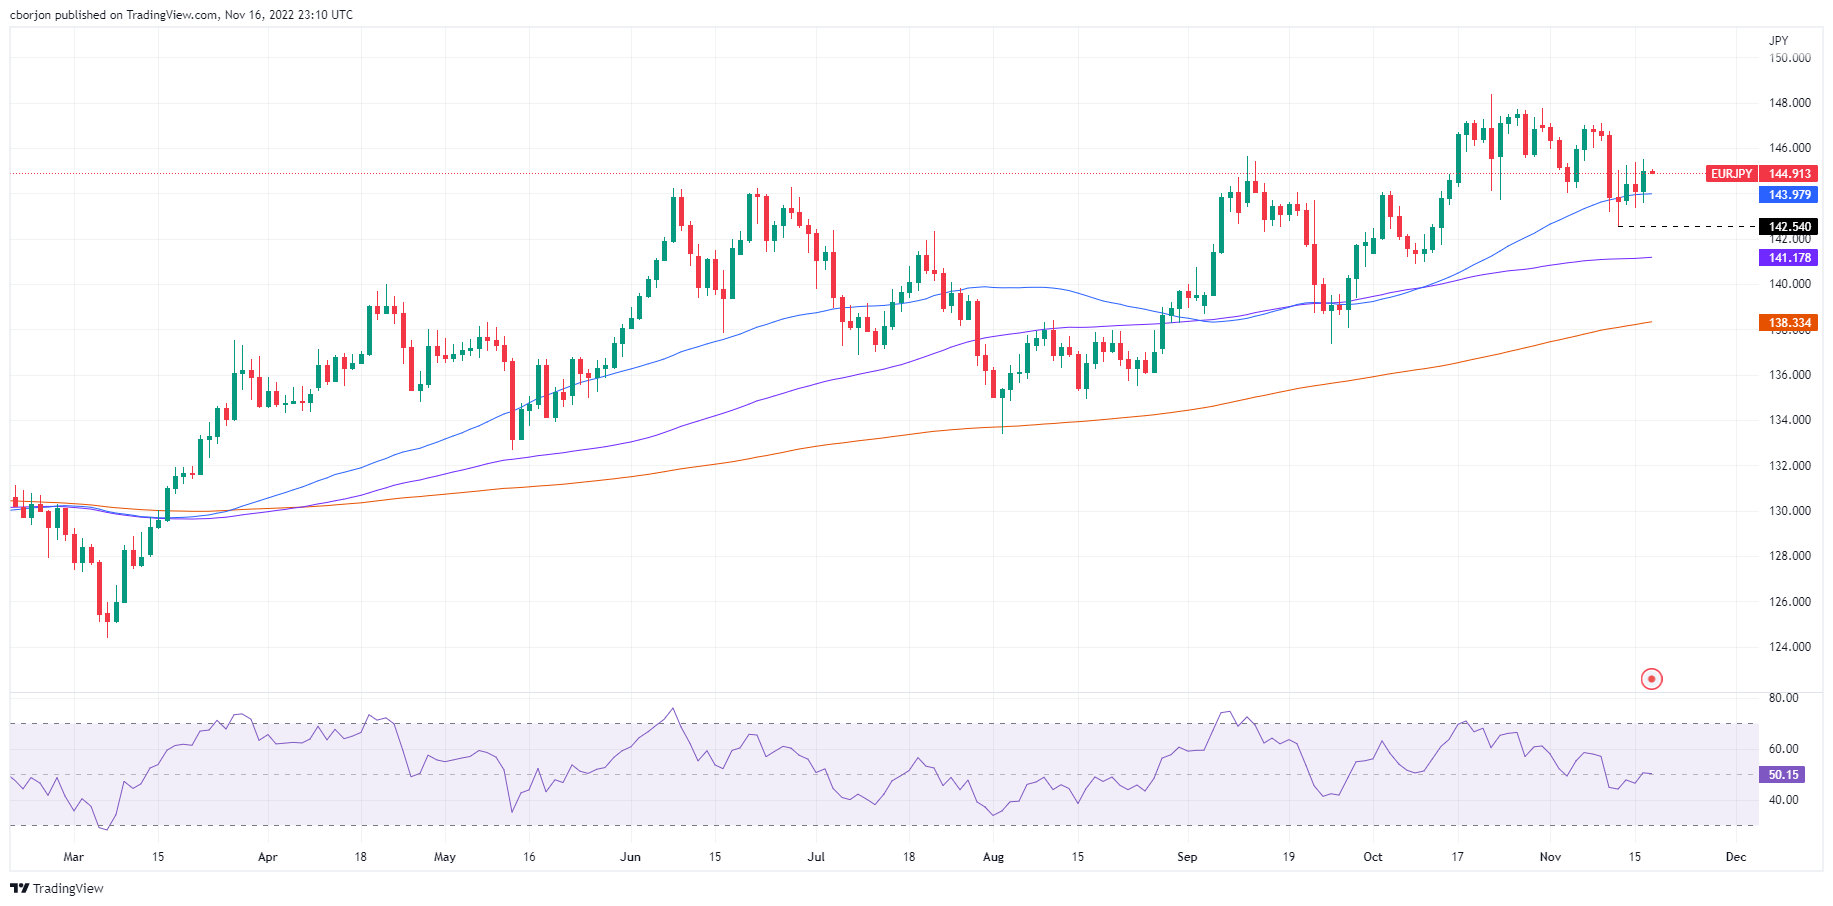
  • If the EURJPY tumbles below the 100-day EMA, a fall toward 142.50s is on the cards.

The EURJPY erased last Tuesday’s losses on Wednesday and rose more than 0.60% amidst a risk-off impulse spurred by a positive Retail Sales report in the United States. Given the jump in sales in the report, speculations that the Federal Reserve (Fed) would continue aggressively tightening augmented, though Fed officials’ commentary, calmed traders. At the time of writing, the EURJPY is trading at 145.01, above its opening price by 0.02%, as the Asian session begins.

EURJPY Price Analysis: Technical outlook

The EURJPY trades shy of the weekly highs reached on Wednesday, around 145.49. Earlier, the EURJPY hit a daily low at 143.56, below the 50-day Exponential Moving Average (EMA) at 143.98, but Euro (EUR) buyers lifted the cross-currency pair, reclaiming the 144.00 and 145.00 psychological price levels. Of note, the Relative Strength Index (RSI) climbed above its 50-midline, showing buyers gathered momentum. However, late in the New York session, RSI’s slope aimed downward, a signal that buying pressure was fading.

Therefore, the EURJPY’s first resistance would be the weekly high at 145.49. Break above will expose the 146.00 psychological level, followed by the 147.00 mark.

On the other hand, the EURJPY’s first support would be the 145.00 mark. Once cleared, the next demand area would be the 50-day EMA at 143.98, followed by the last week’s low at 142.54.

EURJPY Key Technical Levels

EUR/JPY

Overview
Today last price144.99
Today Daily Change0.89
Today Daily Change %0.62
Today daily open144.1
 
Trends
Daily SMA20145.97
Daily SMA50143.98
Daily SMA100141.16
Daily SMA200138.25
 
Levels
Previous Daily High145.36
Previous Daily Low143.35
Previous Weekly High147.11
Previous Weekly Low142.56
Previous Monthly High148.4
Previous Monthly Low140.9
Daily Fibonacci 38.2%144.12
Daily Fibonacci 61.8%144.59
Daily Pivot Point S1143.18
Daily Pivot Point S2142.26
Daily Pivot Point S3141.17
Daily Pivot Point R1145.19
Daily Pivot Point R2146.28
Daily Pivot Point R3147.2

Author

Christian Borjon Valencia

Markets analyst, news editor, and trading instructor with over 14 years of experience across FX, commodities, US equity indices, and global macro markets.

More from Christian Borjon Valencia
Share:

Editor's Picks

EUR/USD appears supported by the 200-day SMA, for now

Following an early pullback to multi-week lows near 1.1670, EUR/USD now manages to reclaim the 1.1700 region as the NA session draws to a close on Monday. The steep retracement in spot follows the equally strong move higher in the US Dollar, as investors continue to assess the geopolitical landscape in the wake of the US and Israel attacks on Iran.


GBP/USD hits new yearly lows near 1.3300

GBP/USD adds to the recent bearish tone, approaching to the key 1.3300 support to reach fresh YTD troughs against the backdrop of the robust performance of the US Dollar. Indeed, Cable’s decline comes amid the firm demand for the safe-haven space in the wake of the US and Israel attacks to Iran.

Gold eases some ground, approaches $5,300

Gold now surrenders part of the earlier advance, reshifting its attenton to the $5,300 zone per troy ounce at the beginning of the week. Indeed, the yellow metal’s firm performance appears propped up by incresing geopolitical jitters in the Middle East, which at the same time fuels the demand for the safe-haven space.

Strategy lifts holdings to 3.4% of Bitcoin's total supply amid inflows into crypto products

Strategy continued its accumulation of the top crypto last week, acquiring 3,015 BTC for $204 million amid renewed interest in crypto products after four weeks of outflows.

The Fed is finally talking about AI – Here's why it matters for the US Dollar

AI is moving from earnings calls into the heart of monetary policy discussions, forcing Federal Reserve officials to confront a new question: How to act if AI reshapes inflation, employment and interest rates at the same time?

Grass 20% bullish breakout defies broader market weakness

Grass (GRASS) is edging up above $0.30 at the time of writing on Monday. The token’s notable 20% intraday surge stands out amid heightened volatility in the broader crypto market.