EUR/USD falls to lower 1.0900s after release of US CPI data
- EUR/USD trades lower on Tuesday after the release of US CPI data for February.
- The data shows inflationary forces remaining stubbornly high.
- US CPI has impacted the timing of Fed interest rate cuts, indicating a hgiher chance they will be delayed – USD positive.

EUR/USD declines to the lower 1.0900s on Tuesday during the US session after the release of US Consumer Price Index (CPI) inflation data showed inflationary pressures were higher than expected in February.
The CPI report suggests the Federal Reserve (Fed) may have to keep interest rates higher for longer to cool the economy. Relatively higher interest rates for longer is a positive driver for the US Dollar as they attract more foreign capital inflows.
The fact that Gasoline and Energy prices were two of the biggest contributors to elevated inflation, however, will probably limit EUR/USD downside, since these are seen as less entrenched pressures and subject to global commodity price fluctuations.
US CPI comes out higher than forecast
The EUR/USD takes another step lower on Tuesday as US inflation shows unexpected stickiness in February.
The US Consumer Price Index ex Food and Energy (core) inflation came out at 3.8% YoY when analysts had expected a 3.7% result. The figure was lower than the 3.9% recorded in January, however, suggesting inflation is coming down, only not as quickly as forecast.
On a monthly basis, core CPI rose 0.4%, which was higher than the 0.3% forecast and equal to the 0.4% recorded in January.
The broader headline CPI figure showed an unexpected rise of 3.2% YoY, against the 3.1% forecast. This was also higher than the 3.1% recorded in January.
On a monthly basis headline CPI rose 0.4%, which was in line with estimates and higher than the 0.3% registered in January.
According to the CME FedWatch Tool, which calculates a market-based expectation of when the Federal Reserve will begin reducing its Fed Funds Rate, the probability of a first rate cut in March has fallen to 1%, from 3% prior to the CPI release. The chance of one or more 25 bps cuts by May is now 16.8% from 17.1% prior to the CPI release. The probability of one or more interest rate cuts by June is now 69.7% from 71.4% prior to the data.
Euro overpriced and likely to fall
The Euro is overpriced given the relatively weaker growth in the Eurozone and the likelihood of earlier rate cuts in Europe compared to the US, says BNY Mellon strategist Geoffrey Yu.
In an interview with Bloomberg news on Monday, the strategist said he expects the Euro to weaken against the US Dollar in 2024.
“I’m still holding onto my view that at some point this year we’re going to get parity with the Dollar,” said Yu.
Weakness is likely to come from a two pronged attack on the Euro, from a combination of a weak economy and the European Central Bank (ECB) cutting interest rates before the Fed.
Recently EUR/USD failed to sustain highs just shy of 1.1000 after Banque de France Governor, François Villeroy de Galhau and Bundesbank President Dr. Joachim Nagel, both said that a rate cut in the spring might be warranted.
De Galhau said that “spring goes from April to June 21.”
Their stance is more radical than that of ECB President Christine Lagarde, who said she saw June as the time for the ECB to review its interest rate policy at her press conference after the policy meeting on March 7.
Technical Analysis: EUR/USD pulling back
EUR/USD has corrected back from its 1.0981 peak established on March 8.
Despite the correction, the pair remains in a short-term uptrend with peaks and troughs making consistently higher highs and higher lows on the 4-hour chart. This overall still favors bullish bets.
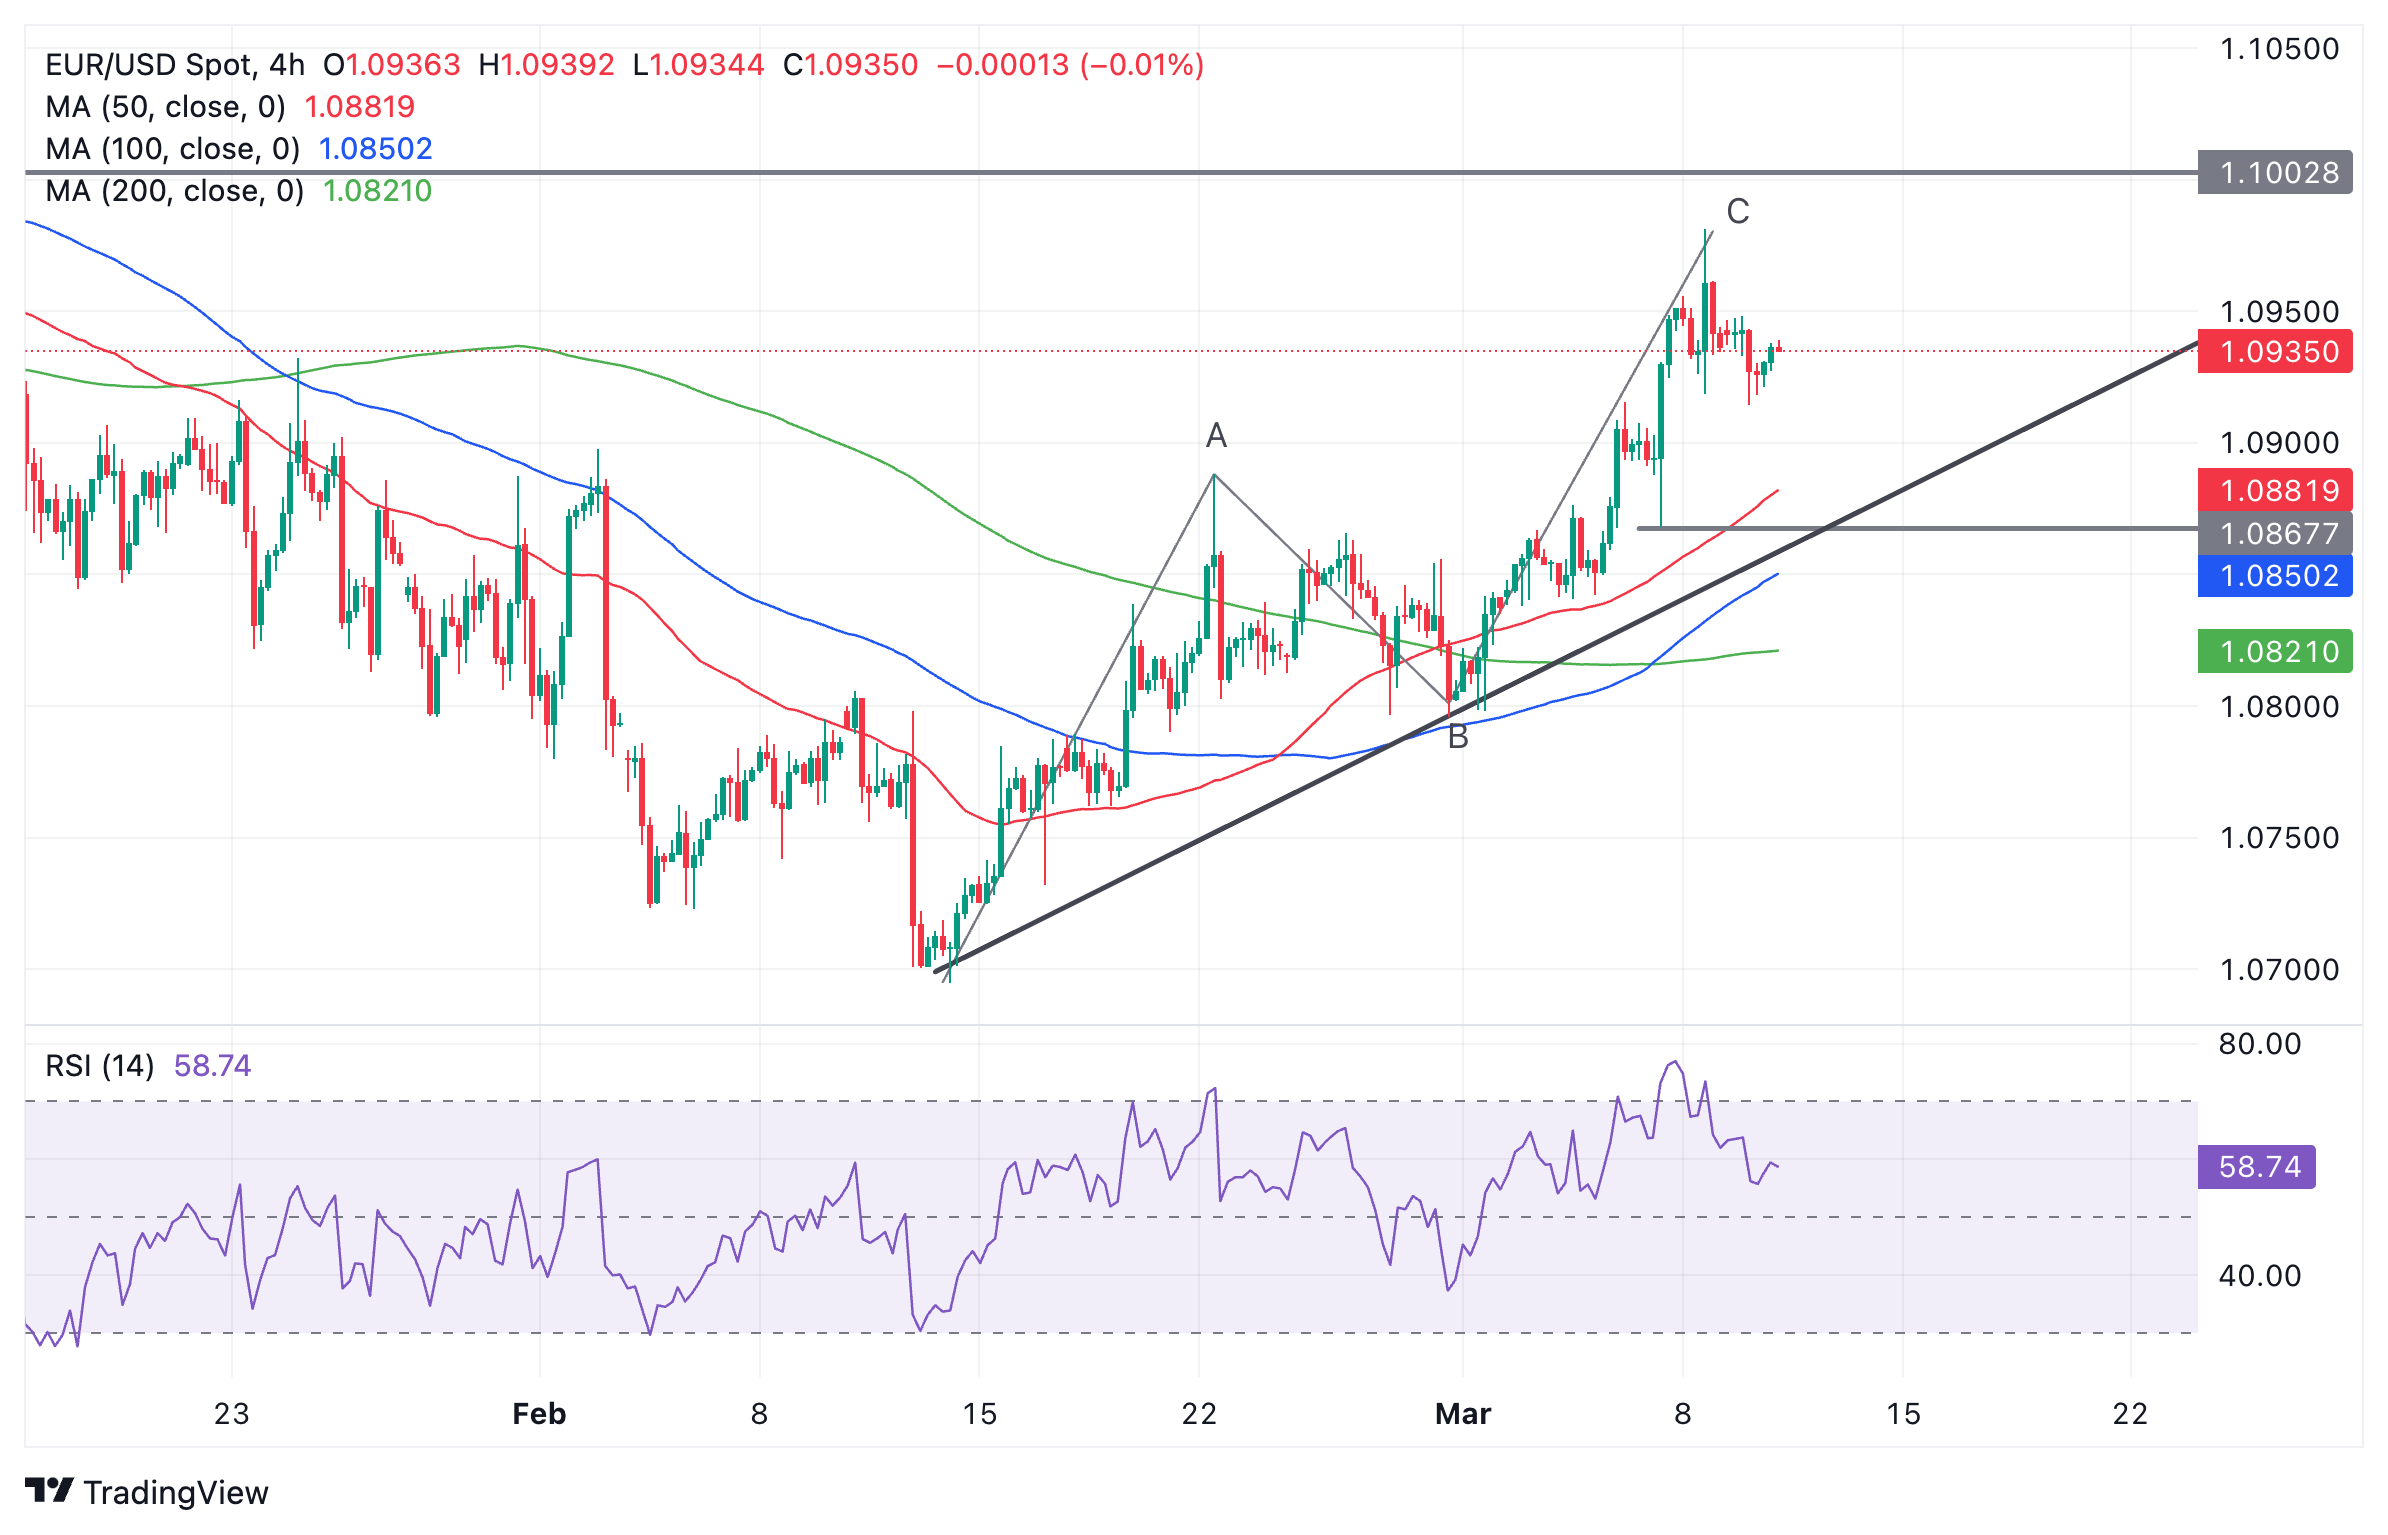
Euro vs US Dollar: 4-hour chart
The pair seems to have completed a three-wave ABC Measured Move pattern, however, suggesting the possibility of a fairly substantial correction unfolding.
The pullback has already traced out in three waves since Friday’s top, and there is a possibility it may have completed.
However, it is also possible it could fall even lower. One possible zone where the correction could find support is between the 1.0898 (February 2 high) and the top of the Measured Move’s A wave at 1.0888.
The correction could still fall back to as low as support in the 1.0860s. However, given the uptrend bias, price will probably eventually find a floor, recover and resume climbing.
The formation of a short-term reversal pattern such as a bullish candlestick reversal pattern would provide a clue the uptrend could be restarting.
Resumption of uptrend
A break above 1.0955 would provide stronger evidence the uptrend was resuming. A move above the 1.0981 high of March 8 would provide a strong signal the bullish trend was further evolving.
The tough resistance expected at 1.1000, however, could see such an up move short-lived unless supported by compelling fundamentals. The 1.1000 psychological level is likely to be the scene of a battle between bulls and bears, with more volatility.
A clear and decisive break above 1.1000, however, would open the gates to further gains towards the next key resistance level at 1.1139, the December 2023 high.
Such a decisive break would be characterized by a long green bar piercing clearly above the level and closing near its high or three green bars in a row, breaching the level.
Economic Indicator
United States Consumer Price Index ex Food & Energy (MoM)
Inflationary or deflationary tendencies are measured by periodically summing the prices of a basket of representative goods and services and presenting the data as the Consumer Price Index (CPI). CPI data is compiled on a monthly basis and released by the US Department of Labor Statistics. The MoM print compares the prices of goods in the reference month to the previous month.The CPI Ex Food & Energy excludes the so-called more volatile food and energy components to give a more accurate measurement of price pressures. Generally speaking, a high reading is seen as bullish for the US Dollar (USD), while a low reading is seen as bearish.
Read more.Why it matters to traders
The US Federal Reserve has a dual mandate of maintaining price stability and maximum employment. According to such mandate, inflation should be at around 2% YoY and has become the weakest pillar of the central bank’s directive ever since the world suffered a pandemic, which extends to these days. Price pressures keep rising amid supply-chain issues and bottlenecks, with the Consumer Price Index (CPI) hanging at multi-decade highs. The Fed has already taken measures to tame inflation and is expected to maintain an aggressive stance in the foreseeable future.
Author

Joaquin Monfort
FXStreet
Joaquin Monfort is a financial writer and analyst with over 10 years experience writing about financial markets and alt data. He holds a degree in Anthropology from London University and a Diploma in Technical analysis.


