|
EUR/USD technical analysis: Euro drops to 1.1107 level as ECB readies an impactful September package
- EUR/USD is trading at weekly lows as the ECB is getting ready to surprise the market.
- ECB's Rehn: ECB stimulus package may beat expectations, EUR/USD drops toward 1.11
- The level to beat for sellers is the 1.1107 support.

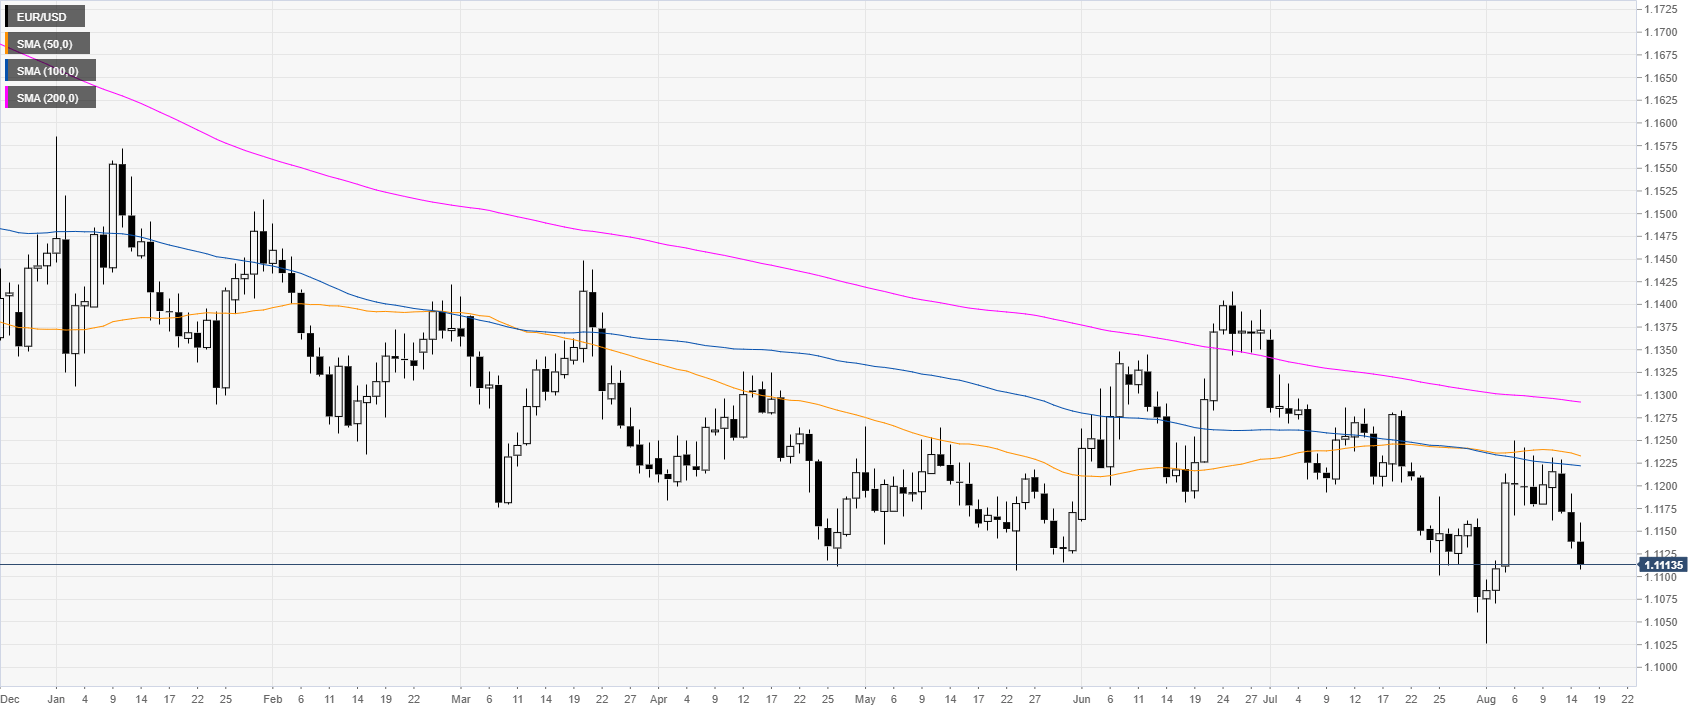
EUR/USD daily chart
On the daily time-frame, the single currency is trading in a bear trend below its main daily simple moving averages (DSMAs). Earlier in the New York session, the US Retail Sales Control Group came in better-than-expected at 1% vs. 0.3% in July. The data brought EUR/USD down to 1.1135 but didn't manage to break the support. What broke 1.1135 was the comments from ECB member Olli Rehn saying that ECB (European Central Bank) stimulus package may beat expectations.
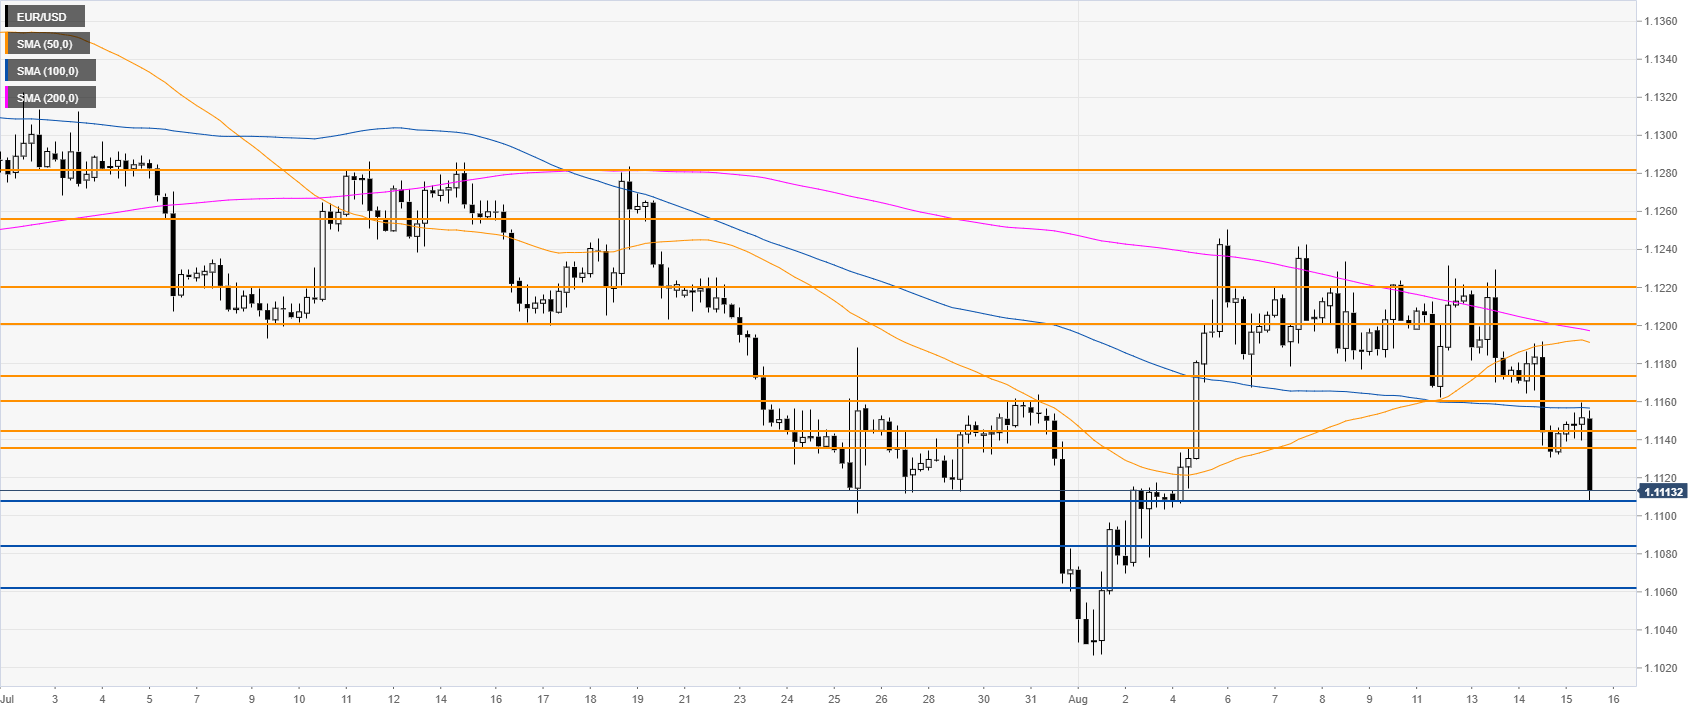
EUR/USD 4-hour chart
The Euro is challenging the 1.1107 support. A beak below the level would open the doors to further losses towards 1.1084 and 1.1061 levels.
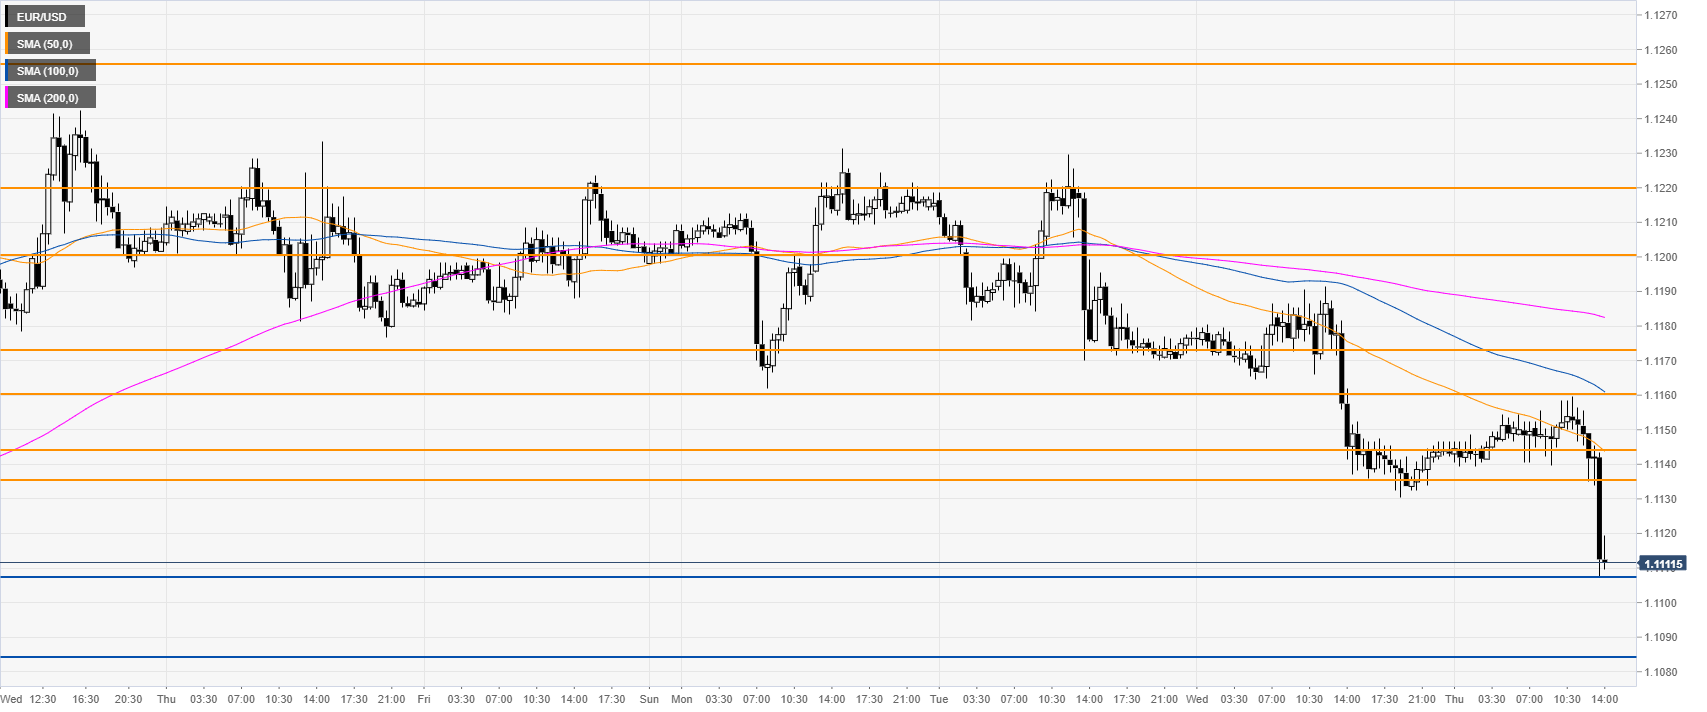
EUR/USD 30-minute chart
The market is under heavy bearish pressure at the daily lows. Immediate resistances are seen at the 1.1135 and 1.1144 levels, according to the Technical Confluences Indicator.
Additional key levels
Author

Flavio Tosti
Independent Analyst
More from Flavio Tosti


