|

EUR/USD Technical Analysis: Bearish view unchanged. Door open for a visit to YTD low at 1.1299

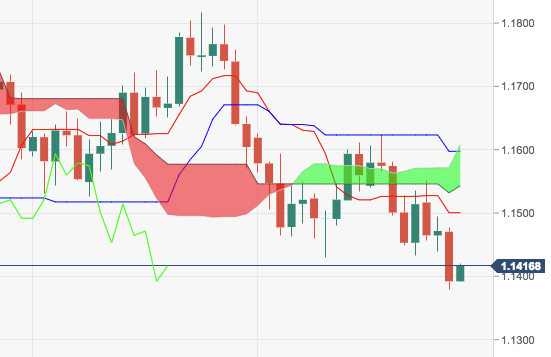
  • The pair is now seeing some recovery after dropping to the 1.1380 area on Wednesday, managing to regain the 1.1400 barrier and above.
  • Further downside should see the critical 200-week SMA tested at 1.1319, considered the last defense of a probable test of 2018 low at 1.1299 (August 15).
  • On the flip side, occasional bullish attempts should meet strong resistance in the 1.1493/1.1520 band, where converge the 10-day SMA, May 29 low and the 21-day SMA.

EUR/USD daily chart

EUR/USD

Overview:
    Last Price: 1.1415
    Daily change: -1.2e+2 pips
    Daily change: -1.01%
    Daily Open: 1.1531
Trends:
    Daily SMA20: 1.1571
    Daily SMA50: 1.1584
    Daily SMA100: 1.1623
    Daily SMA200: 1.1909
Levels:
    Daily High: 1.154
    Daily Low: 1.1531
    Weekly High: 1.1622
    Weekly Low: 1.1433
    Monthly High: 1.1816
    Monthly Low: 1.1526
    Daily Fibonacci 38.2%: 1.1496
    Daily Fibonacci 61.8%: 1.1472
    Daily Pivot Point S1: 1.1453
    Daily Pivot Point S2: 1.1392
    Daily Pivot Point S3: 1.1351
    Daily Pivot Point R1: 1.1555
    Daily Pivot Point R2: 1.1596
    Daily Pivot Point R3: 1.1657

Author

Pablo Piovano

Born and bred in Argentina, Pablo has been carrying on with his passion for FX markets and trading since his first college years.

More from Pablo Piovano
Share:

Editor's Picks

EUR/USD risks a deeper drop below 1.1750

EUR/USD keeps its vacillating mood in place as the the NA session drwas to a close on Tuesday, hovering below the 1.1800 hurdle amid acceptable gains in the US Dollar. In the meantime, market participants and the FX galaxy are expected to closely follow President Trump’s SOTU speech around 2AM GMT.
 

GBP/USD regains 1.3500 and above

GBP/USD extends its advance for the third day in a row on Tuesday, this time retesting the area beyond the 1.3500 hurdle. Cable’s uptick comes despite decent gains in the Greenback and the dovish message from the BoE’s Bailey at the UK Parliament.

Gold appears offered around $5,150

Gold is giving back a good portion of the recent multi-day rally, receding to the $5,150 zone per troy ounce amid the decent bounce in the US Dollar and mixed US Treasuty yields. In the meantime, markets’ attention remain on upcoming comments from Fed speakers.

Ripple’s DeFi shift in focus: Navigating XRPL EVM sidechain growth, XRPFi migration and liquidity
Ripple (XRP) has continued to trade under pressure, extending its decline by approximately 63% from the record high of $3.66 in July. The remittance token is trading above support at $1.35, while its upside appears limited by key supply zones, starting with $1.40, at the time of writing on Tuesday.
The Citrini report: How a debatable AI narrative can shake Wall Street

That AI-related headline alone was enough to rattle investors.US stocks slid sharply on Monday after a widely circulated Citrini Research memo outlined a hypothetical “2028 Global Intelligence Crisis”, warning that rapid AI adoption could push US unemployment into double digits as early as by mid-2028.

XRP pressured by weak ETF flows and declining retail interest

Ripple (XRP) is edging lower, trading above its intraday low of $1.32 at the time of writing on Tuesday. The decline from its weekly opening of $1.39 reflects heightened volatility in the broader cryptocurrency market, accentuated by tariff-triggered uncertainty.