|

EUR/USD Price Analysis: W-formation opens risk to a 38.2% Fibo reversion

  • EUR/USD is stalling just below the daily 20 EMA.
  • A period of sideways accumulation could be on the cards for the near term. 

EUR/USD has shot higher in the last few sessions but the rally has stalled and left a doji topping candle on the daily chart. The following is an analysis of both the daily and hourly chart that illustrates a downside bias for the meanwhile. 

EUR/USD daily chart
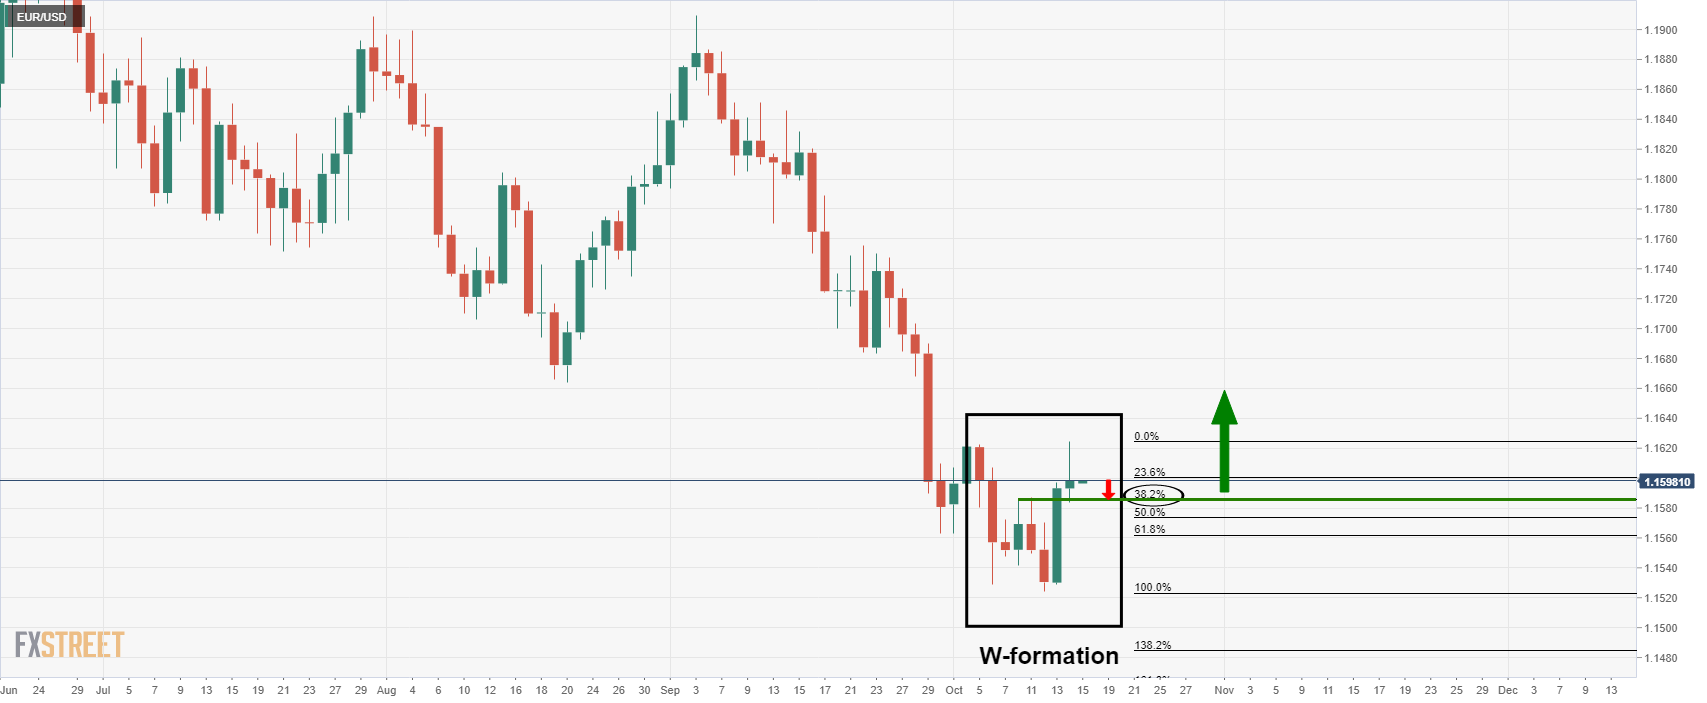
The W0formaiton is a reversion pattern that has a high completion rate. The price would be expected to retest the neckline of the formation from where it might find enough demand in buyers accumulating the euro at a discount. In doing so, that would be expected to lead to a higher high in a fresh daily impulse to the upside. 

EUR/USD 1-hour chart
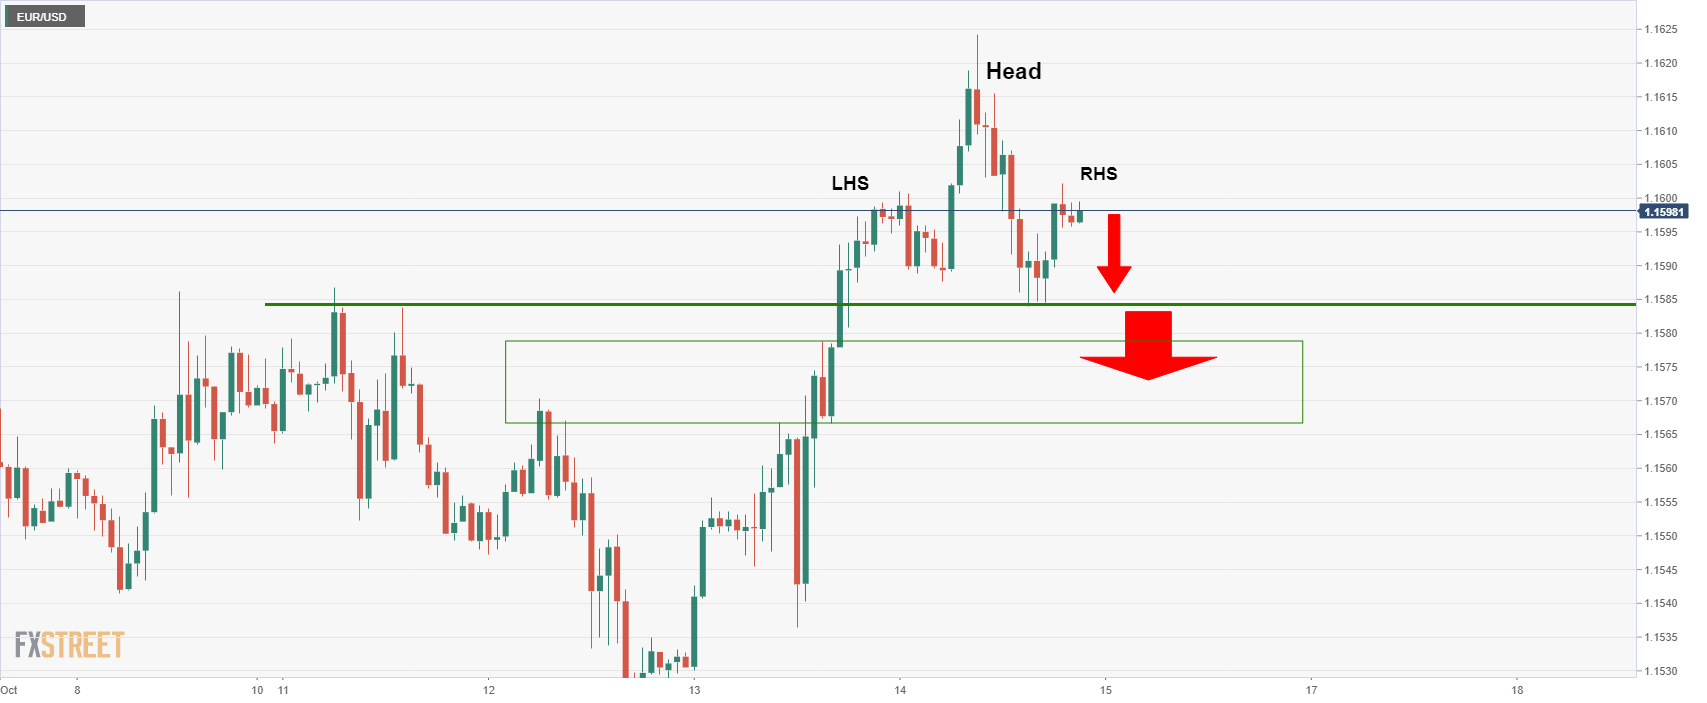
However, from a lower time frame perspective, the hourly chart is forming a bearish head and shoulders, so there are prospects of a downside continuation below the daily 38.2% Fibo target which suggests that the market will remain in a period of sideways accumulation for somewhile longer. 

Author

Ross J Burland

Ross J Burland, born in England, UK, is a sportsman at heart. He played Rugby and Judo for his county, Kent and the South East of England Rugby team.


More from Ross J Burland
Share:

Editor's Picks

GBP/USD slips toward 1.3350 after soft UK CPI data

GBP/USD erases recovery gains and slips toward 1.3350 in the European session on Wednesday. The UK annual Consumer Price Index (CPI) inflation cooled to 2.6% in June against the market forecast of 2.7%, tempering the British Pound's rebound from weekly troughs. Traders also assess the ongoing Mideast tensions amid a pause in the US Dollar uptrend.

EUR/USD holds above 1.1400 amid US Dollar retreat

EUR/USD holds positive ground above 1.1400 in European trading on Wednesday, helped by hawkish ECB expectations and a broad US Dollar retreat. However, persisting Middle East tensions and surging Oil prices keep the pair's upside elusive.

Gold holds gains above $4,100 undaunted by risk-off markets

Gold extends gains for the fourth consecutive day, standing comfortably above $4,100, unfazed by the risk-off market amid rising tensions in Iran and higher Oil prices. The pair has rallied nearly 2.5% so far this week and is on track for its best weekly performance in more than three months.

Cardano: Short-term recovery lacks retail support

Cardano price edges lower after the 50-day Exponential Moving Average at $1.770 capped two consecutive days of recovery seen earlier this week. ADA futures point to waning retail traction as Open Interest and trading volume decline amid elevated long liquidations. The technical outlook for ADA is bearish, as momentum remains subdued below a resistance trendline near $0.1782.

Chip stocks are more volatile than Oil

I continue to start the day by looking at these two charts: US crude & Kospi. The former is extending gains, trading above $86 per barrel for WTI and $92 per barrel for Brent, while the Kospi is up more than 4.5%, led higher by Korean chipmakers following a similar jump in VanEck's Semiconductor ETF yesterday.

US Dollar mid-year outlook: Exceptional currency, exceptional risks?
The US Dollar enters the second half of 2026 in a markedly different position from a year ago. The King currency has recovered, reflecting persistent US inflation, changing expectations for Fed policy, geopolitical tensions and renewed demand for defensive assets.