EUR/USD Price Analysis: Retreats towards 1.0620 support confluence


  • EUR/USD remains pressured around short-term key support, snaps two-day uptrend.
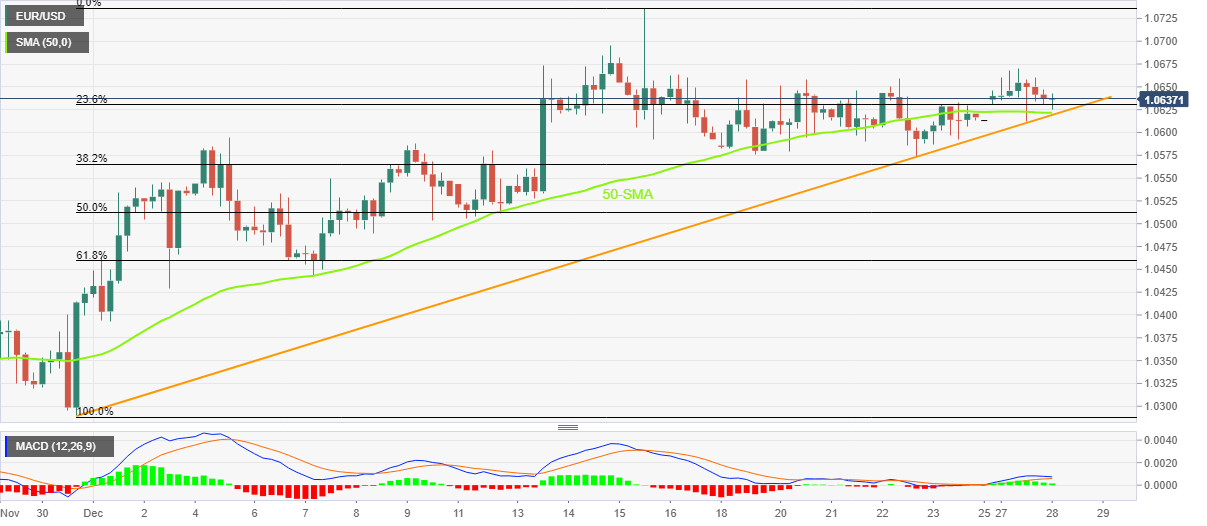
  • Convergence of 50-SMA, one-month-old ascending trend line puts a floor under the prices.
  • Impending bear cross on MACD also keeps sellers hopeful.

EUR/USD prints mild losses around 1.0635 despite recently bouncing off the intraday low. The reason could be linked to the previous day’s U-turn from the 1.0669 level, which in turn allows the major currency pair to snap a two-day winning streak by the press time.

In addition to the quote’s retreat from 1.0669, the looming bear cross on the MACD also teases the EUR/USD sellers of late.

However, a clear downside break of the 1.0620 support confluence comprising the 50-SMA and an upward-sloping trend line from late November becomes necessary for the EUR/USD sellers to retake control.

Following that, the previous weekly low near 1.0590 could lure intraday bears ahead of the 50% Fibonacci retracement level of the pair’s November 30 to December 15 upside, close to 1.0510.

In a case where the EUR/USD prices remain weak past 1.0510, the 61.8% Fibonacci retracement, also known as the golden ratio, near 1.0460 could act as the last defense of the pair buyers.

On the contrary, recovery moves need to stay beyond the latest swing high surrounding 1.0670 to direct the EUR/USD pair buyers toward the monthly high of 1.0736.

Also acting as an upside filter is May’s peak of around 1.0790 and the 1.0800 round figure.

Overall, EUR/USD is likely to return to the bear’s radar but a clear break of 1.0620 is necessary.

EUR/USD: Four-hour chart

Trend: Further downside expected

Additional important levels

Overview
Today last price 1.0632
Today Daily Change -0.0009
Today Daily Change % -0.08%
Today daily open 1.0641
 
Trends
Daily SMA20 1.0569
Daily SMA50 1.0296
Daily SMA100 1.0115
Daily SMA200 1.033
 
Levels
Previous Daily High 1.067
Previous Daily Low 1.0612
Previous Weekly High 1.0659
Previous Weekly Low 1.0573
Previous Monthly High 1.0497
Previous Monthly Low 0.973
Daily Fibonacci 38.2% 1.0648
Daily Fibonacci 61.8% 1.0634
Daily Pivot Point S1 1.0612
Daily Pivot Point S2 1.0583
Daily Pivot Point S3 1.0554
Daily Pivot Point R1 1.067
Daily Pivot Point R2 1.0699
Daily Pivot Point R3 1.0728


Share: Feed news

Information on these pages contains forward-looking statements that involve risks and uncertainties. Markets and instruments profiled on this page are for informational purposes only and should not in any way come across as a recommendation to buy or sell in these assets. You should do your own thorough research before making any investment decisions. FXStreet does not in any way guarantee that this information is free from mistakes, errors, or material misstatements. It also does not guarantee that this information is of a timely nature. Investing in Open Markets involves a great deal of risk, including the loss of all or a portion of your investment, as well as emotional distress. All risks, losses and costs associated with investing, including total loss of principal, are your responsibility. The views and opinions expressed in this article are those of the authors and do not necessarily reflect the official policy or position of FXStreet nor its advertisers. The author will not be held responsible for information that is found at the end of links posted on this page.

If not otherwise explicitly mentioned in the body of the article, at the time of writing, the author has no position in any stock mentioned in this article and no business relationship with any company mentioned. The author has not received compensation for writing this article, other than from FXStreet.

FXStreet and the author do not provide personalized recommendations. The author makes no representations as to the accuracy, completeness, or suitability of this information. FXStreet and the author will not be liable for any errors, omissions or any losses, injuries or damages arising from this information and its display or use. Errors and omissions excepted.

The author and FXStreet are not registered investment advisors and nothing in this article is intended to be investment advice.

Recommended content


Recommended content

Editors’ Picks

AUD/USD steadies despite rising US inflation, traders eye Aussie WPI

AUD/USD steadies despite rising US inflation, traders eye Aussie WPI

The Australian Dollar registered gains against the US Dollar on Tuesday, even though inflation in the United States edged, spurring hawkish remarks by Fed Chair Jerome Powell. The AUD/USD trades near 0.6624, virtually unchanged as Wednesday’s Asian session commences.

AUD/USD News

EUR/USD targets the 1.0880 zone ahead of US, EMU data

EUR/USD targets the 1.0880 zone ahead of US, EMU data

EUR/USD kept the bullish bias well in place for the second session in a row, leaving behind the 1.0800 barrier and the key 200-day SMA (1.0790) prior to key data releases in the EMU and US on Wednesday.

EUR/USD News

Gold regains its poise on broad US Dollar’s weakness

Gold regains its poise on broad US Dollar’s weakness

Following Monday's decline, Gold stages a rebound toward $2,350 on Tuesday. The benchmark 10-year US Treasury bond yield stays in negative territory below 4.5% after April producer inflation data, allowing XAU/USD to hold its ground.

Gold News

Bitcoin price defends $61K with GameStop stock resurgence likely to generate renewed appetite for risk assets

Bitcoin price defends $61K with GameStop stock resurgence likely to generate renewed appetite for risk assets

Bitcoin (BTC) price tests the patience of traders as it glides along an ascending trendline on the four-hour time frame. Meanwhile, the GameStop saga that has resurfaced after three years distracts the market.

Read more

Is the US Dollar headed for a crash?

Is the US Dollar headed for a crash?

Ahead of the US CPI & Retail Sales report, I breakdown how to combine forex fundamentals with technicals to determine whether we've seen a US dollar top? 

Read more

Forex MAJORS

Cryptocurrencies

Signatures