|

EUR/USD Price Analysis: Rebounds firmly from above 1.0700 as focus shifts to US Employment

  • EUR/USD has shown a decent recovery from 1.0700 after witnessing sheer volatility in the USD index.
  • Eurozone headline and core inflation are seen declining to 6.3% and 5.5% respectively.
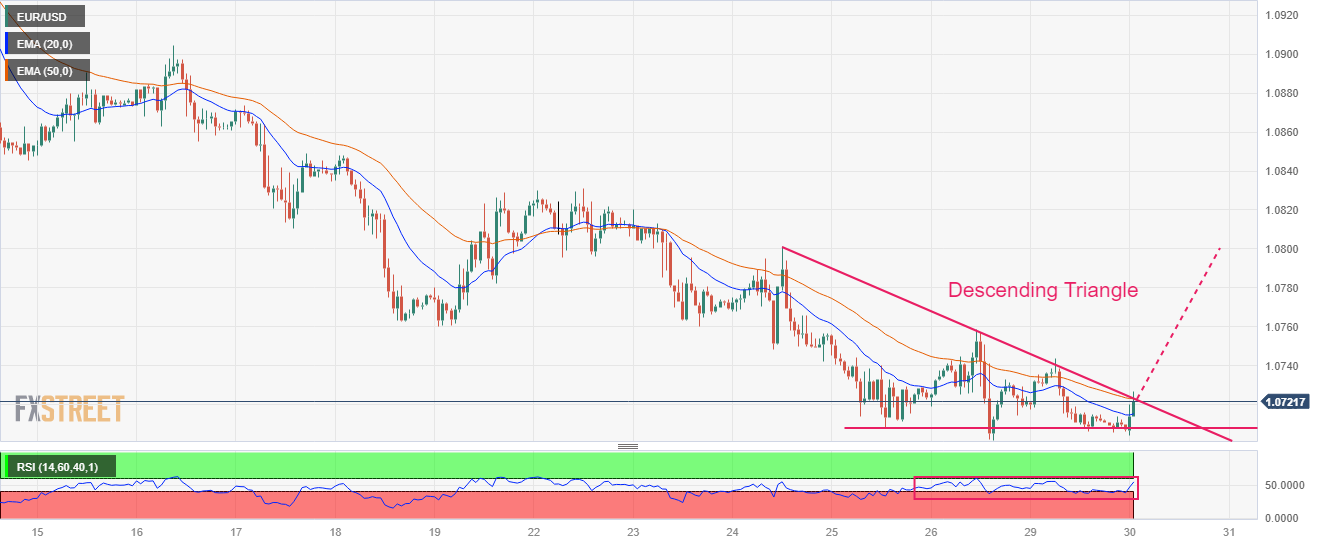
  • EUR/USD is attempting a breakout of the Descending Triangle chart pattern.

The EUR/USD pair has shown a decent recovery after defending its immediate support around 1.0700 in the Asian session. A recovery move in the major currency pair is being supported by a sell-off in the US Dollar Index (DXY). The USD index has slipped firmly below 104.20 as a raise in the US debt-ceiling is weighing heavily.

This week, the USD Index will be guided by the US Employment-linked economic indicators. From job openings to hiring figures, the entire gamut will portray current labor market conditions.

Meanwhile, the Euro bulls will also remain in action amid the release of the preliminary Eurozone inflation data (May). As per the consensus, headline inflation is seen declining to 6.3% vs. the former release of 7.0%. Core inflation is expected to show a minor deceleration to 5.5% against the prior release of 5.6%.

EUR/USD is attempting a breakout of the Descending Triangle chart pattern formed on an hourly scale. The downward-sloping trendline of the aforementioned chart pattern is potted from May 24 high around 1.0800. Horizontal support of the chart pattern is placed from May 25 low at 1.0707.

The shared currency pair has climbed above the 20-period Exponential Moving Average (EMA) at 1.0715 and is aiming to shift auction above the 50-EMA at 1.0724.

A break into the 60.00-80.00 range by the Relative Strength Index (RSI) (14) will trigger the upside momentum.

Should the asset break above the day’s high at 1.0726, Euro bulls would drive the major currency pair toward May 19 low at 1.0760. and the round-level resistance at 1.0800.

In an alternate scenario, the downside move will resume if the shared currency pair drops below the round-level support of 1.0700. This will drag the asset toward March 13 low at 1.0650 followed by March 03 low at 1.0588.

EUR/USD hourly chart

EUR/USD

Overview
Today last price1.0722
Today Daily Change0.0014
Today Daily Change %0.13
Today daily open1.0708
 
Trends
Daily SMA201.0873
Daily SMA501.0903
Daily SMA1001.0816
Daily SMA2001.0487
 
Levels
Previous Daily High1.0744
Previous Daily Low1.0706
Previous Weekly High1.0831
Previous Weekly Low1.0702
Previous Monthly High1.1095
Previous Monthly Low1.0788
Daily Fibonacci 38.2%1.072
Daily Fibonacci 61.8%1.0729
Daily Pivot Point S11.0695
Daily Pivot Point S21.0681
Daily Pivot Point S31.0657
Daily Pivot Point R11.0733
Daily Pivot Point R21.0757
Daily Pivot Point R31.0771

Author

Sagar Dua

Sagar Dua

FXStreet

Sagar Dua is associated with the financial markets from his college days. Along with pursuing post-graduation in Commerce in 2014, he started his markets training with chart analysis.

More from Sagar Dua
Share:

Editor's Picks

EUR/USD deflates to fresh lows, targets 1.1600

The selling pressure on EUR/USD now gathers extra pace, prompting the pair to hit fresh multi-week lows in the 1.1625-1.1620 band on Friday. The continuation of the downward bias comes in response to further gains in the US Dollar as market participants continue to assess the mixed release of US Nonfarm Payrolls in December.

GBP/USD breaks below 1.3400, challenges the 200-day SMA

GBP/USD remains under heavy fire and retreats for the fourth consecutive day on Friday. Indeed, Cable suffers the strong performance of the Greenback, intensified post-mixed NFP, and trades at shouting distance from its critical 200-day SMA near 1.3380.

Gold flirts with yearly tops around $4,500

Gold keeps its positive bias on Friday, adding to Thursday’s advance and challenging yearly highs in the $4,500 region per troy ounce. The risk-off sentiment favours the yellow metal despite the firmer tone in the Greenback and rising US Treasury yields.

Crypto Today: Bitcoin, Ethereum, XRP risk further decline as market fear persists amid slowing demand

Bitcoin holds $90,000 but stays below the 50-day EMA as institutional demand wanes. Ethereum steadies above $3,000 but remains structurally weak due to ETF outflows. XRP ETFs resume inflows, but the price struggles to gain ground above key support.

Week ahead – US CPI might challenge the geopolitics-boosted Dollar

Geopolitics may try to steal the limelight from US data. A possible US Supreme Court ruling on tariffs could dictate market movements. A crammed data calendar next week, US CPI comes on Tuesday; Fedspeak to intensify.

XRP trades under pressure amid weak retail demand

XRP presses down on the 50-day EMA support as risk-averse sentiment spreads despite a positive start to 2026. XRP faces declining retail demand, as reflected in futures Open Interest, which has fallen to $4.15 billion.