|

EUR/USD Price Analysis: Holds above 1.09, charts show failed breakout

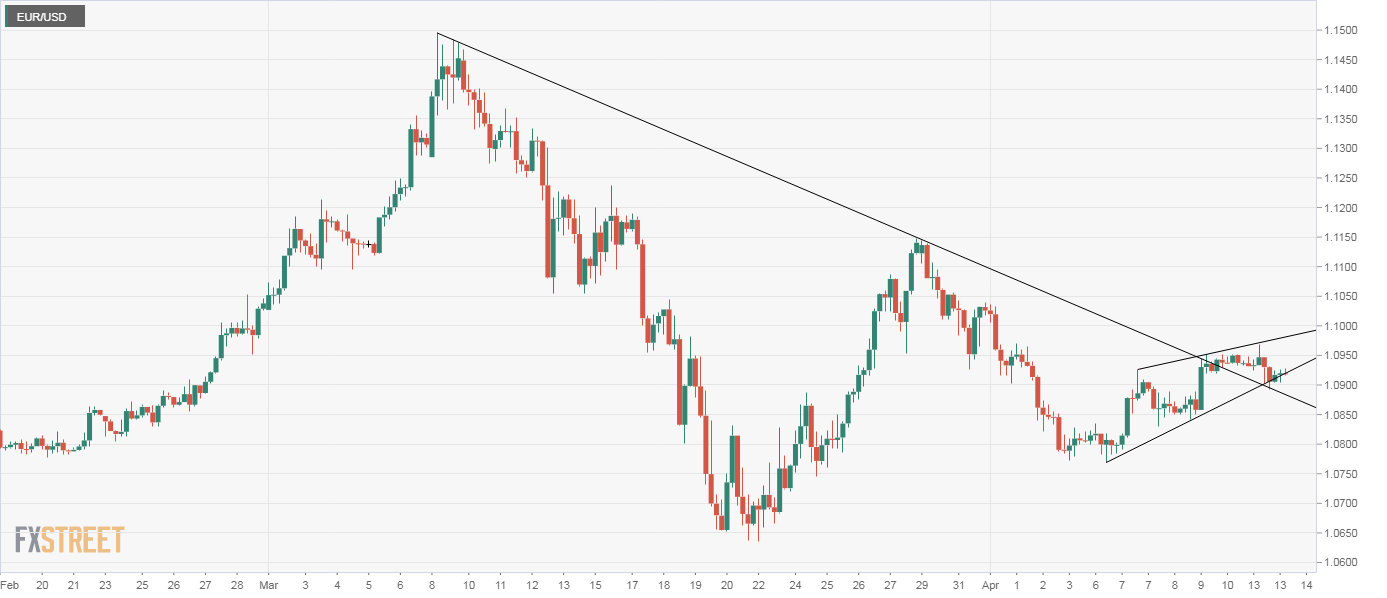
  • EUR/USD's 4-hour chart shows risks are skewed to the downside. 
  • A move above 1.10 is needed to turn the tide in favor of the bulls. 

EUR/USD is trading in the green near 1.0918 at press time, having found bids near 1.0890 on Monday. 

The path of least resistance is to the downside, as the 4-hour chart is reporting a failed breakout - the spot breached the descending trendline connecting March 8 and March 29 highs last week with a move above 1.0940. So far, however, that has failed to entice buyers, as evidenced by the pullback from 1.0968 to 1.0918.

Further, the 4-hour chart shows a rising wedge breakdown, a bearish reversal pattern, which indicates the corrective bounce from 1.0768 has ended and sellers have regained control. 

All in all, risks appear skewed in favor of a drop to 1.0768. A convincing move above 1.10 (4-hour chart 200-candle average) is needed to put the bulls back into the driver's seat. 

4-hour chart

Trend: Bearish

Technical levels

EUR/USD

Overview
Today last price1.0918
Today Daily Change0.0004
Today Daily Change %0.04
Today daily open1.0914
 
Trends
Daily SMA201.0895
Daily SMA501.0969
Daily SMA1001.1035
Daily SMA2001.106
 
Levels
Previous Daily High1.0968
Previous Daily Low1.0893
Previous Weekly High1.0952
Previous Weekly Low1.0768
Previous Monthly High1.1497
Previous Monthly Low1.0636
Daily Fibonacci 38.2%1.0921
Daily Fibonacci 61.8%1.0939
Daily Pivot Point S11.0882
Daily Pivot Point S21.085
Daily Pivot Point S31.0807
Daily Pivot Point R11.0957
Daily Pivot Point R21.1
Daily Pivot Point R31.1032

Author

Omkar Godbole

Omkar Godbole

FXStreet Contributor

Omkar Godbole, editor and analyst, joined FXStreet after four years as a research analyst at several Indian brokerage companies.

More from Omkar Godbole
Share:

Editor's Picks

EUR/USD recovers further from one-month low set on Friday, eyes mid-1.1800s on weaker USD

The EUR/USD pair is seen building on Friday's late recovery from the 1.1750-1.1740 region, or a nearly one-month trough, and gaining some follow-through positive traction at the start of a new week. The momentum lifts spot prices to the 1.1835 area during the Asian session and is sponsored by a broadly weaker US Dollar.

GBP/USD gathers strength above 1.3500 amid tariff confusion

The GBP/USD pair gains traction to around 1.3520 during the early Asian session on Monday. The US Dollar faces some selling pressure against the Cable as tariff uncertainty lingers. Traders will take more cues from the US Producer Price Index report for January, which will be published later on Friday. 

Gold eyes a daily closing above key 61.8% Fibo resistance

Gold is adding over 1% early Monday, after having gained 2% on Friday. The bright metal scales key technical hurdles, as buyers stay strong amid renewed tariffs and economic uncertainty alongside looming US-Iran geopolitical tensions.

Top Crypto Losers: Zcash, Pump.fun, and LayerZero extended losses as Bitcoin loses $65,000

The cryptocurrency market starts the week in panic mode, with altcoins Zcash, Pump.fun, and LayerZero. Bitcoin falls below $65,000 as the US President Donald Trump regroups amid renewed trade policy risks.

Liberation day take two, the tariff machine just changed gears

Let me caveat this from the outset. What we are watching is first-order mechanics, not the grand macro endgame. This is the market’s immediate reflex to a 15% Trump tariff levy dressed up as judicial drama. The Supreme Court blocked Trump tarrif hammer. The White House came back with a scalpel.

Top Crypto Losers: Zcash, Pump.fun, and LayerZero extended losses as Bitcoin loses $65,000

The cryptocurrency market starts the week in panic mode, with altcoins Zcash, Pump.fun, and LayerZero. Bitcoin falls below $65,000 as the US President Donald Trump regroups amid renewed trade policy risks.