|

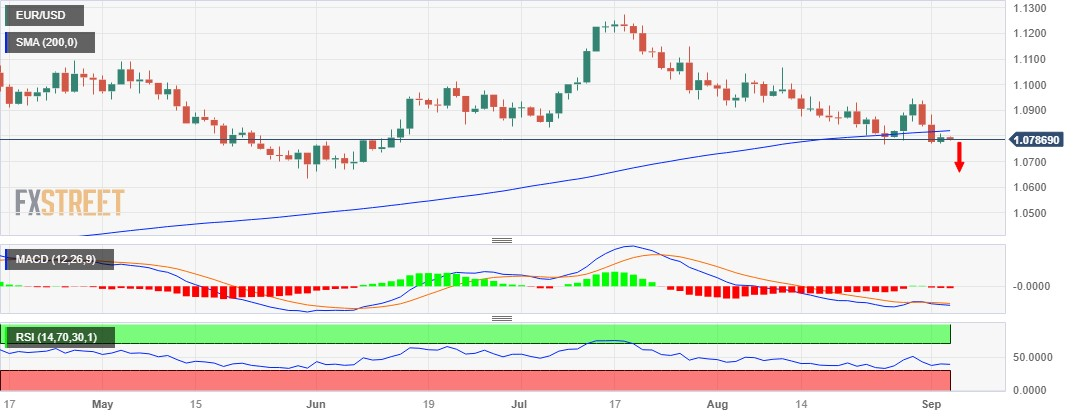
EUR/USD Price Analysis: Hangs near two-month low, bears have the upper hand below 200-day SMA

  • EUR/USD meets with fresh supply on Tuesday and is weighed down by a modest USD uptick.
  • The technical setup suggests that the path of least resistance for spot prices is to the downside.
  • Attempted recovery might still be seen as a selling opportunity and is likely to remain capped.

The EUR/USD pair struggles to capitalize on the previous day's modest gains and attracts fresh sellers in the vicinity of the 1.0800 round-figure mark during the Asian session on Tuesday. Spot prices, meanwhile, remain well within the striking distance of over a two-month low, around the 1.0765 region touched in July and seem vulnerable below a technically significant 200-day Simple Moving Average (SMA).

The negative outlook for the EUR/USD pair is reinforced by the fact that oscillators on the daily chart are holding deep in the bearish territory and are still far from being in the oversold zone. Apart from this, the emergence of some US Dollar (USD) buying suggests that the path of least resistance for spot prices is to the downside. Hence, a subsequent slide to the 1.0765 region, en route to the 1.0700 mark, looks like a distinct possibility.

The next relevant support is pegged near the May monthly swing low, around the 1.0635 region. This is followed by the 1.0600 round figure, which if broken decisively will be seen as a fresh trigger for bearish traders and pave the way for deeper losses. The EUR/USD pair might then turn vulnerable and accelerate the fall towards the 1.0530-1.0525 intermediate support before eventually dropping to the 1.0500 psychological mark.

On the flip side, recovery above the 1.0800 level is likely to confront stiff resistance near the 200-day SMA, currently around the 1.0815-1.0820 region. A sustained strength beyond might trigger a short-covering rally and allow the EUR/USD pair to reclaim the 1.0900 round-figure mark. Any subsequent move up, however, might still be seen as a selling opportunity and remain capped near last week's swing high, around the 1.0840-1.0845 zone.

The latter should act as a pivotal point for the EUR/USD pair, which if cleared decisively will suggest that the recent sharp pullback from the 1.1275 region, or a 17-month peak touched in July has run its course. This, in turn, will set the stage for some meaningful near-term appreciating move.

EUR/USD daily chart

fxsoriginal

Technical levels to watch

EUR/USD

Overview
Today last price1.0784
Today Daily Change-0.0011
Today Daily Change %-0.10
Today daily open1.0795
 
Trends
Daily SMA201.0877
Daily SMA501.0966
Daily SMA1001.0921
Daily SMA2001.0818
 
Levels
Previous Daily High1.0809
Previous Daily Low1.0772
Previous Weekly High1.0946
Previous Weekly Low1.0772
Previous Monthly High1.1065
Previous Monthly Low1.0766
Daily Fibonacci 38.2%1.0795
Daily Fibonacci 61.8%1.0786
Daily Pivot Point S11.0775
Daily Pivot Point S21.0755
Daily Pivot Point S31.0738
Daily Pivot Point R11.0812
Daily Pivot Point R21.0829
Daily Pivot Point R31.0849

Author

Haresh Menghani

Haresh Menghani is a detail-oriented professional with 10+ years of extensive experience in analysing the global financial markets.

More from Haresh Menghani
Share:

Editor's Picks

EUR/USD holds losses below 1.1650 on renewed USD uptick

EUR/USD is off the low but remains in the red below 1.1650 in European trading on Thursday. The pair faces headwinds from a renewed uptick in the US Dollar amid a negative shift in risk sentiment. Surging energy prices due to the Middle East war keep the bearish pressure intact on the Euro. The US Jobless Claims data are next of note. 

GBP/USD stays weak near 1.3350 amid UK stagflation risks

GBP/USD sticks to losses near 1.3350 in the European session on Thursday. The Pound Sterling loses ground amid fears that the United Kingdom economy could face stagflation risks due to higher energy prices, while the US Dollar attracts fresh havem demand ahead of the US Jobless Claims data. 

Gold climbs near $5,200 as Iran war fuels safe-haven demand

Gold price extends its gains for the second successive session on Thursday as traders seek safety amid the ongoing war in the Middle East. US and Israeli strikes across Iranian territory and widespread Iranian missile and drone retaliation across the Middle East, including attacks on regional targets and military sites, prolong the crisis and its impact.

Top Crypto Gainers: Decred, Zcash, and Dogecoin lead recovery as Bitcoin crosses $72,000

Bitcoin trades above $72,500 at press time on Thursday, holding its 6% gain from the previous day, contributing to a broader market recovery. The total cryptocurrency market capitalization stands at over $2.43 trillion as the broader market sentiment improves significantly.

FX alert: When Energy still writes the macro script the Dollar holds the pen

The market is quietly sliding back into the trade nobody wanted to own, but everyone now has to respect again. The no quick off-ramp trade. Yesterday’s bounce in risk assets already looks less like a turning point and more like a classic relief rally in a market that briefly inhaled before realizing the room was still on fire.

Cardano Price Analysis: Approaches key trendline amid bearish sentiment

Cardano (ADA) price is approaching its descending trendline around $0.28 at the time of writing, set to shape the next directional move. The derivatives metrics paint a bearish picture, with ADA’s Open Interest continuing to fall and short bets rising among traders.