|

EUR/USD Price Analysis: Falling wedge on 4H tests bearish impulse below 1.2100

  • EUR/USD wavers in a small range after bouncing off seven-week low.
  • Bullish chart pattern, recovering MACD keep buyers hopeful.
  • Early February lows, 61.8% Fibonacci retracement add to the downside filters.

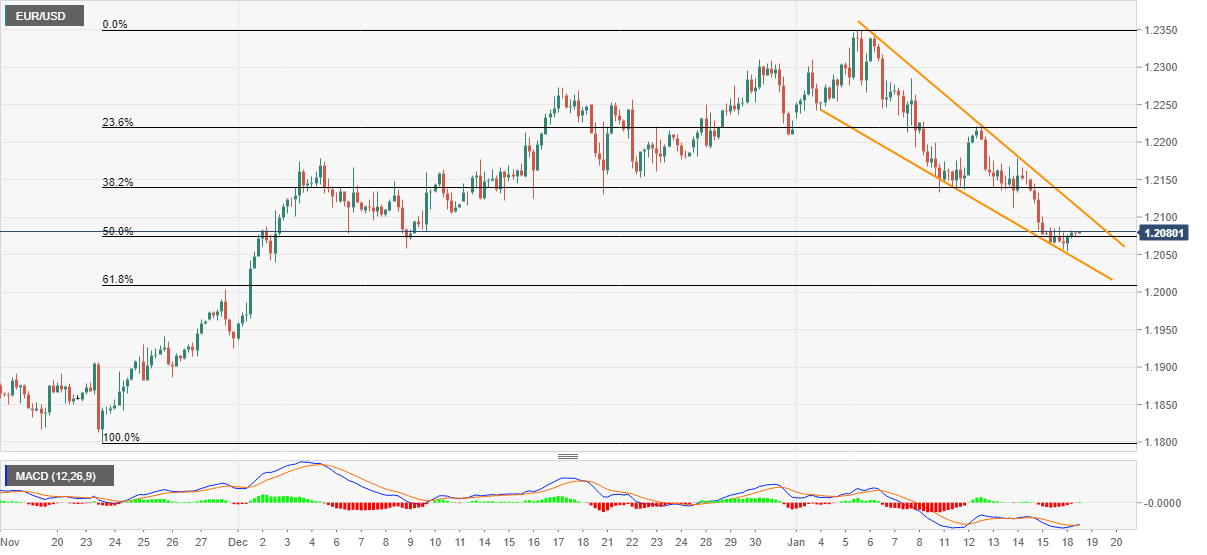
EUR/USD portrays choppy trading moves between 1.2075 and 1.2080, currently near 1.2076, during Tuesday’s Asian session. The pair dropped to the lowest since December 02 the previous day before taking a U-turn from the support line of a two-week-old falling wedge chart pattern on the four-hour (4H) play.

Considering the recovery in prices backed by the improving MACD signals, the quote is likely to direct the corrective pullback towards the 1.2100 threshold, for now.

However, any further upside past-1.2100 needs to cross the falling wedge’s resistance line, at 1.2116 now, to recall the EUR/USD buyers eyeing to refresh the multi-month high above 1.2349.

During the upside, Wednesday’s top around 1.2210 can offer an intermediate halt while April 2018 peak surrounding 1.2415 can please the bulls afterward.

On the contrary, the quote’s U-turn from present levels will have strong support around 1.2045/40 area including the pattern’s lower line and December 02 trough.

Even if the EUR/USD prices remain weak past-1.2040, 61.8% Fibonacci retracement of November 23 to January 06 upside and November 30 top, around 1.2010-1.2000, will challenge the south-run.

EUR/USD four-hour chart

Trend: Pullback expected

Additional important levels

Overview
Today last price1.2078
Today Daily Change1 pips
Today Daily Change %0.01%
Today daily open1.2077
 
Trends
Daily SMA201.2205
Daily SMA501.2087
Daily SMA1001.1931
Daily SMA2001.1617
 
Levels
Previous Daily High1.2087
Previous Daily Low1.2054
Previous Weekly High1.2227
Previous Weekly Low1.2077
Previous Monthly High1.231
Previous Monthly Low1.1924
Daily Fibonacci 38.2%1.2066
Daily Fibonacci 61.8%1.2074
Daily Pivot Point S11.2058
Daily Pivot Point S21.2039
Daily Pivot Point S31.2024
Daily Pivot Point R11.2091
Daily Pivot Point R21.2106
Daily Pivot Point R31.2125

Author

Anil Panchal

Anil Panchal

FXStreet

Anil Panchal has nearly 15 years of experience in tracking financial markets. With a keen interest in macroeconomics, Anil aptly tracks global news/updates and stays well-informed about the global financial moves and their implications.

More from Anil Panchal
Share:

Editor's Picks

AUD/USD advances modestly, hovers around 0.7050

AUD/USD reverses part of Friday’s sharp decline and gyrates around the 0.7050 region ahead of the opening bell in Asia. The pair’s modest recovery comes amid humble losses in the Greenback, always amid the steady uncertainty on the geopolitical front. Moving forward, Westpac’s Consumer Confidence measure will be the salient release on Tuesday.

USD/JPY holds higher ground toward 160.50 despite 'Yentervention' fears

USD/JPY holds higher ground toward 160.50 in Monday's Asian trading, despite intervention fears. Japan’s revised GDP print, which confirmed that the economy lost momentum in the first quarter, weighs on the Japanese Yen. Meanwhile, Friday's upbeat US NFP report and fresh Israel-Iran attacks favor the US Dollar bulls, underpinning the currency pair.

Gold faces initial resistance near  $4,350

Gold manages to reclaim the $4,300 mark per troy ounce and above on Monday. The yellow metal’s small uptick comes on the back of modest losses in the US Dollar, while traders continue to follow geopolitical events in the Middle East and the likelihood of a tighter-for-longer Fed.

Why institutions prefer Solana over newer rivals for stablecoin adoption – Solstice CEO
The cryptocurrency industry has entered a new era spearheaded by stablecoins, real-world asset (RWA) tokenization, decentralized finance (DeFi), and Artificial Intelligence (AI) applications.
$1.75 trillion: Is SpaceX the most popular IPO in history, or the most engineered?

On June 12, the largest initial public offering (IPO) in history is set to hit the tape, and almost nobody is asking whether the price is right, because almost everybody already wants in.

The US economy defies the rules: 100 days into the Oil shock and the recession signal is still missing

More than three months after the start of the Iran war and the resulting disruption to global energy markets, the US economy continues to display remarkable resilience. The conflict has triggered a sharp rise in Oil prices, reignited inflationary pressures and fueled widespread concerns about a potential economic slowdown.