|

EUR/USD Price Analysis: Eyes pullback after failure to beat macro trendline hurdle

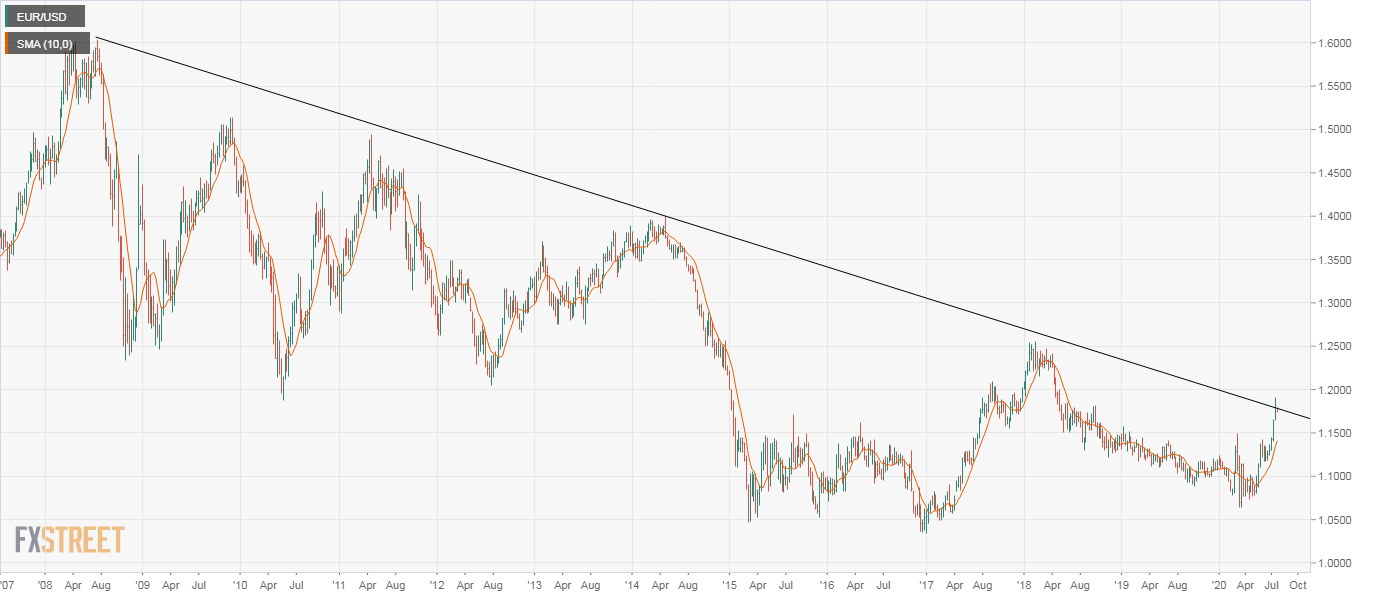
  • EUR/USD fails to take out a 12-year-long bearish trendline. 
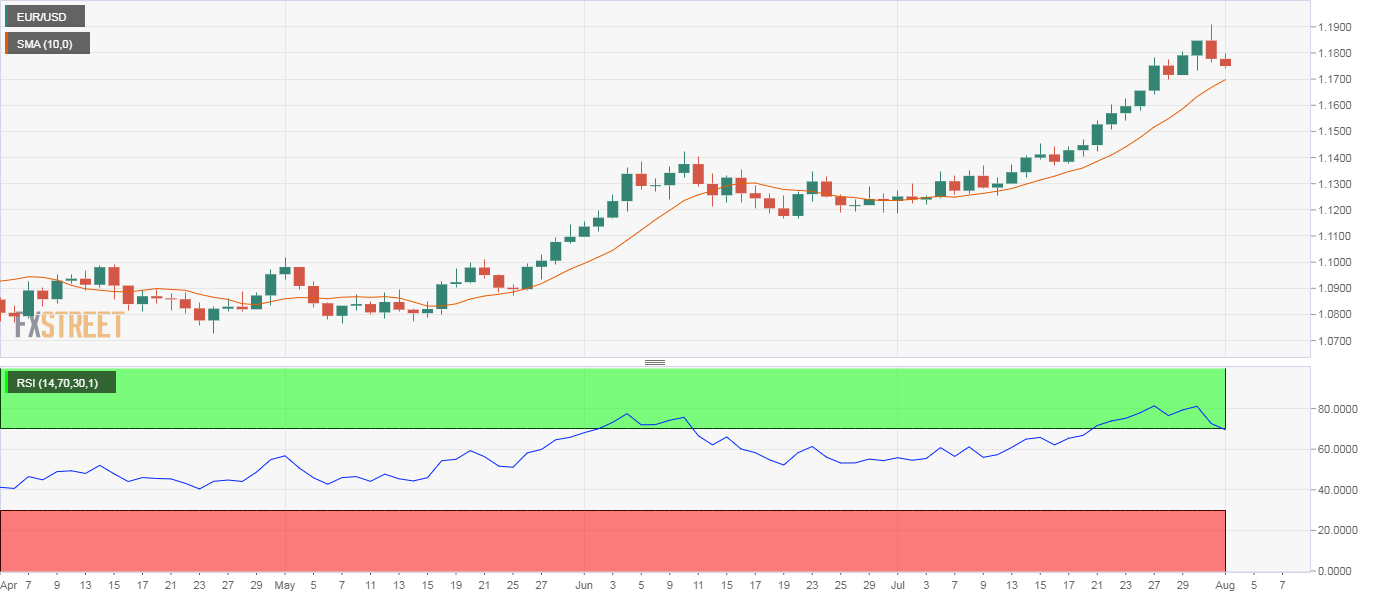
  • Daily RSI continues to show overbought conditions for the euro. 

EUR/USD is trading in the red near 1.1755 at press time, having hit a 26-month high of 1.1909 on Friday. 

Notably, on Friday, the pair fell 0.60% and failed to close above the resistance of trendline falling from 2008 and 2014 highs. 

That, alongside an overbought or above-70 reading on the relative strength index is indicative of ebbing of bullish momentum. 

As such, the pair may test dip demand by testing the 10-day simple moving average (SMA), which is currently located at 1.1698. 

Acceptance under that level could cause some buyers to exit the market, leading to a deeper decline toward 1.1495 (March 9 high). 

Alternatively, the immediate bullish bias would be revived if the 10-day SMA support holds ground. 

Daily chart

Weekly chart

Trend: Pullback underway

Technical levels

EUR/USD

Overview
Today last price1.1781
Today Daily Change0.0003
Today Daily Change %0.03
Today daily open1.1778
 
Trends
Daily SMA201.1507
Daily SMA501.1332
Daily SMA1001.1109
Daily SMA2001.1089
 
Levels
Previous Daily High1.1909
Previous Daily Low1.1762
Previous Weekly High1.1909
Previous Weekly Low1.1642
Previous Monthly High1.1909
Previous Monthly Low1.1185
Daily Fibonacci 38.2%1.1818
Daily Fibonacci 61.8%1.1853
Daily Pivot Point S11.1723
Daily Pivot Point S21.1669
Daily Pivot Point S31.1576
Daily Pivot Point R11.187
Daily Pivot Point R21.1963
Daily Pivot Point R31.2017

Author

Omkar Godbole

Omkar Godbole

FXStreet Contributor

Omkar Godbole, editor and analyst, joined FXStreet after four years as a research analyst at several Indian brokerage companies.

More from Omkar Godbole
Share:

Editor's Picks

EUR/USD stays well offered below 1.1800

The selling pressure on EUR/USD is picking up pace, with the pair slipping decisively below the key 1.1800 level and sliding to fresh two week lows as Wednesday’s session draws to a close. The move lower comes as the US Dollar finds renewed strength after the latest round of US data and the release of the FOMC Minutes. Next of note on the docket will be the US weekly Initial Jobless Claims.
 

GBP/USD reaches multi-day lows near 1.3500

GBP/USD reverses its initial upside momentum and is now adding to previous declines, approaching the 1.3500 region on Wednesday. Cable’s downtick comes on the back of decent gains in the Greenback and easing UK inflation figures, which seem to have reinforced the case for a BoE rate cut in March.

Gold battle to regain $5,000 continues

Gold is back on the front foot on Wednesday, shaking off part of the early week softness and challenging two-day highs near the $5,000 mark per troy ounce. The move comes ahead of the FOMC Minutes and is unfolding despite an intense rebound in the US Dollar.

Bitcoin has found or is near a bottom, extended consolidation to follow: K33

Bitcoin (BTC) is nearing or has already established a bottom, which could be followed by a sustained period of slow price movement, according to K33.

Mixed UK inflation data no gamechanger for the Bank of England

Food inflation plunged in January, but service sector price pressure is proving stickier. We continue to expect Bank of England rate cuts in March and June. The latest UK inflation read is a mixed bag for the Bank of England, but we doubt it drastically changes the odds of a March rate cut.

Sui extends sideways action ahead of Grayscale’s GSUI ETF launch

Sui is extending its downtrend for the second consecutive day, trading at 0.95 at the time of writing on Wednesday. The Layer-1 token is down over 16% in February and approximately 34% from the start of the year, aligning with the overall bearish sentiment across the crypto market.