|

EUR/USD Price Analysis: Euro nearing 2020 lows, approaching 1.0800 figure

  • EUR/USD is dropping on broad-based USD strength.
  • EUR/USD is nearing the 2020 low currently located at the 1.0777 level.
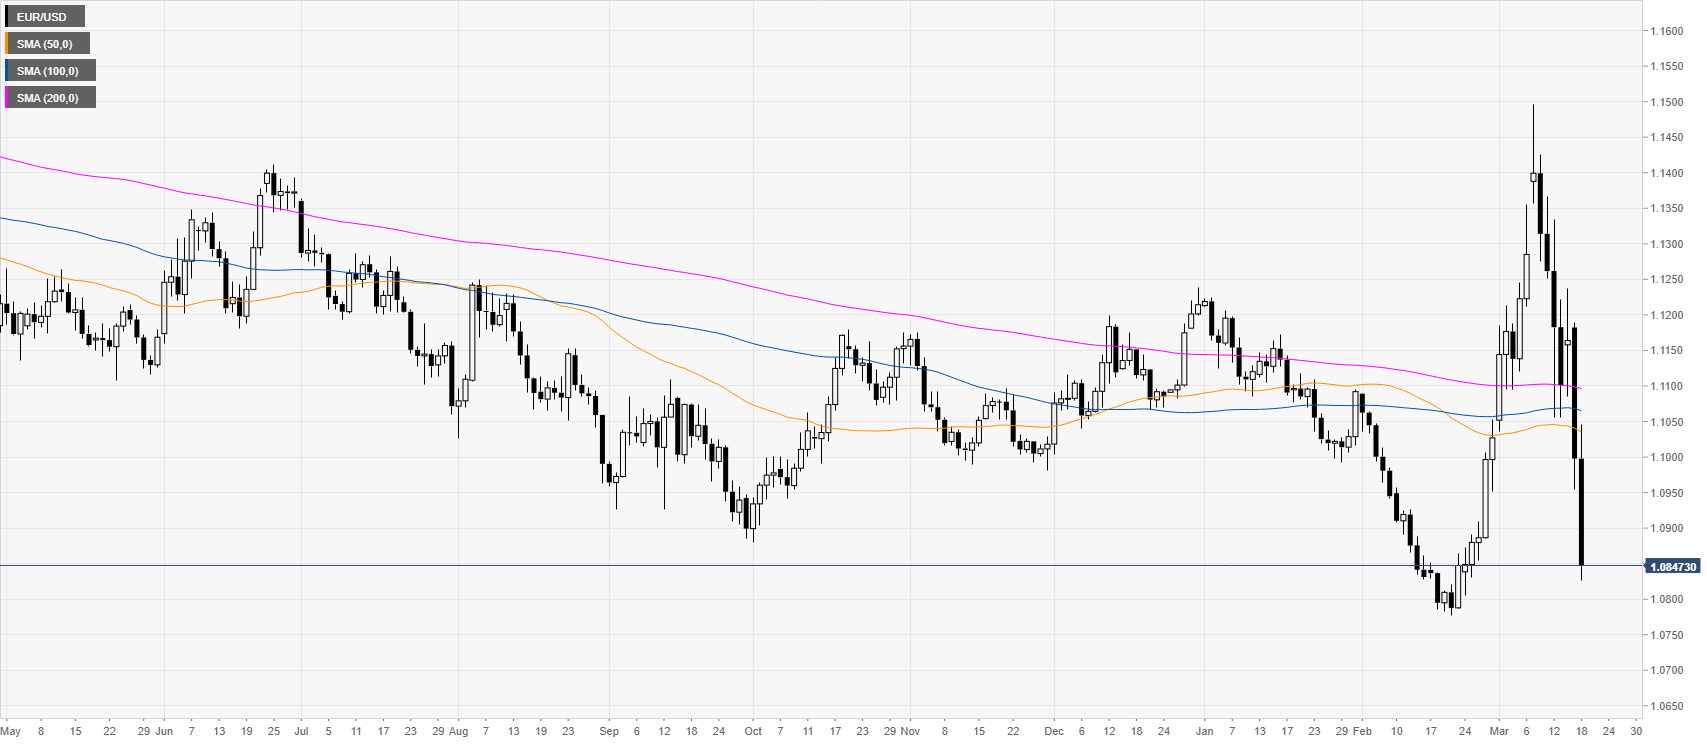
 

EUR/USD daily chart 

 
EUR/USD is approaching the 2020 low at 1.0777 while trading below its main SMAs. DXY (US dollar index) is soaring while pushing EUR/USD down while recording, on Tuesday, its largest daily decline since June 2018. 
  

EUR/USD four-hour chart

 
EUR/USD broke strongly to the downside now trading just below the 1.0852 resistance and the main SMAs. As bears remain in control the market can decline further towards the 1.0784, 1.0716 and 1.0650 price levels, according to the Technical Confluences Indicator. Resistance can be seen near the 1.0852, 1.0900 and 1.0970 levels.   
  

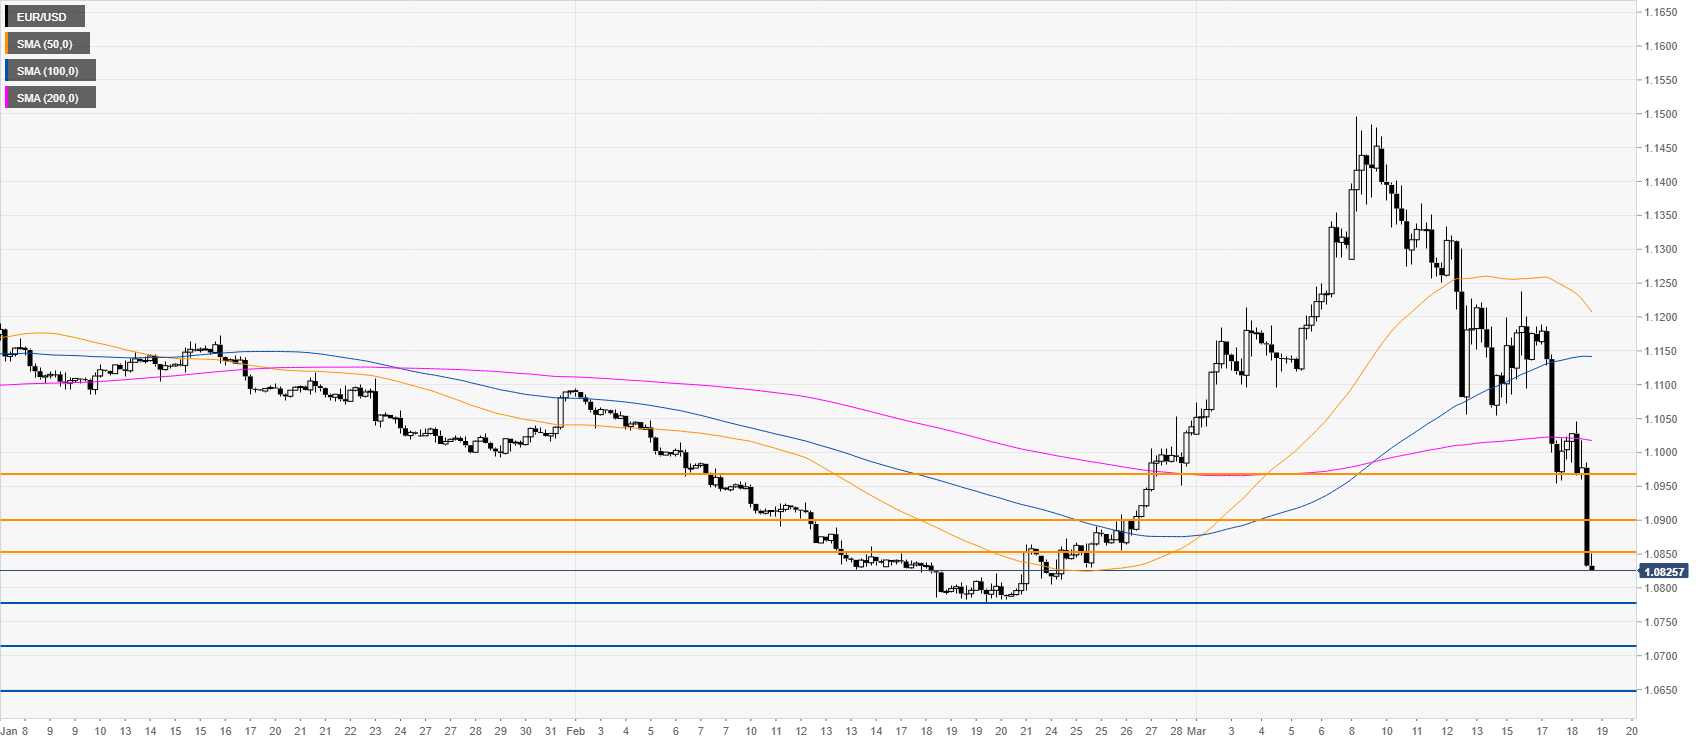
Resistance: 1.0852, 1.0900, 1.0970

Support: 1.0784, 1.0716, 1.0650


Additional key levels

EUR/USD

Overview
Today last price1.0849
Today Daily Change-0.0149
Today Daily Change %-1.35
Today daily open1.0998
 
Trends
Daily SMA201.1078
Daily SMA501.1042
Daily SMA1001.1069
Daily SMA2001.1098
 
Levels
Previous Daily High1.1189
Previous Daily Low1.0955
Previous Weekly High1.1497
Previous Weekly Low1.1055
Previous Monthly High1.1089
Previous Monthly Low1.0778
Daily Fibonacci 38.2%1.1044
Daily Fibonacci 61.8%1.11
Daily Pivot Point S11.0905
Daily Pivot Point S21.0813
Daily Pivot Point S31.0671
Daily Pivot Point R11.114
Daily Pivot Point R21.1282
Daily Pivot Point R31.1374

Author

Flavio Tosti

Flavio Tosti

Independent Analyst


More from Flavio Tosti
Share:

Editor's Picks

EUR/USD seems fragile below 1.1700 as Middle East war boosts energy prices

The EUR/USD pair trades flat at around 1.1680 during the Asian trading session on Tuesday, but broadly seems vulnerable, being close to its five-week low. The major currency pair is under pressure as surging oil prices due to the United States-Israel war with Iran have increased the risks of higher inflation for the Old Continent.

GBP/USD hovers around 1.3400 with bearish pressure intact

GBP/USD edges higher after three days of losses, trading around 1.3400 during the Asian hours on Tuesday. The technical analysis of the daily chart indicates an ongoing bearish bias, as the pair trades within a descending channel pattern.

Gold stays bullish as Iran war continues to spur safe-haven flows

Gold is finding renewed bids in Asian trades on Tuesday, making another attempt to regain the $5,400 level amid persistent demand for safe-haven assets as the Iran war extends. A softer risk tone remains in play as US President Donald Trump continues to threaten deeper escalation to the ongoing war with Iran, warning that a “big wave” is yet to come.

Top Crypto Gainers: Near Protocol, Virtuals Protocol, and Morpho lead market recovery

Near Protocol, Virtuals Protocol, and Morpho are leading the market recovery with double-digit gains over the last 24 hours. Technically, NEAR extends the breakout of the falling channel pattern, VIRTUAL holds above the 50-day EMA, while MORPHO tests a crucial resistance. 

The market is not panicking it is repricing the probability distribution of Oil and time

At the end of the day, markets do not trade morality or geopolitics. They trade transmission channels. And the only channel that truly matters in this maelstrom runs through the price of energy and the time value of money.

Grass 20% bullish breakout defies broader market weakness

Grass (GRASS) is edging up above $0.30 at the time of writing on Monday. The token’s notable 20% intraday surge stands out amid heightened volatility in the broader crypto market.