EUR/USD Price Analysis: Bulls keep reins above 1.0220 support confluence


  • EUR/USD remains sidelined after ending the week on a negative note, despite refreshing monthly peak.
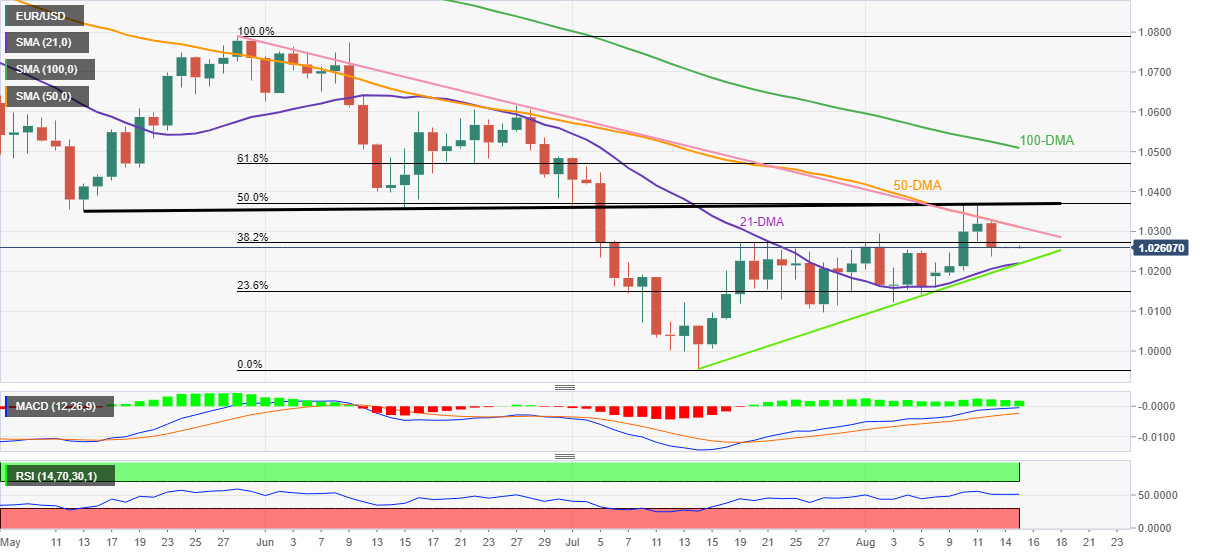
  • Convergence of 21-DMA, one-month-old ascending trend line restricts immediate downside.
  • Descending resistance line from May-end guards immediate upside, three-month-old ascending trend line, 50% Fibonacci retracement appears tough nut to crack for bulls.
  • MACD, RSI hints at the pair’s further upside momentum.

EUR/USD remains sidelined around 1.0260 after a softer end to the positive week, amid cautious sentiment ahead of Wednesday’s Federal Open Market Committee (FOMC) Minutes.

The major currency pair’s latest moves are clubbed between the 1.0220 support and the 1.0315 resistance levels.

That said, a convergence of the 21-DMA and a one-month-old ascending trend line restricts the immediate downside. On the contrary, the 50-DMA and Descending resistance line from late May questions the EUR/USD bulls.

It’s worth noting that the bullish MACD signals and the firmer RSI (14) line, not overbought, appear to keep the buyers hopeful.

That said, a clear upside break of the 1.0315 hurdle could propel the quote towards an upward sloping support-turned-resistance line from mid-May and the 50% Fibonacci retracement level of May-July downside, near 1.0375.

On the flip side, a daily closing below 1.0220 appears necessary for the EUR/USD bears to retake control.

Following that, multiple levels around 1.0120 and 1.0100 could challenge the pair’s further downside.

In a case where the EUR/USD pair remains weak past 1.0100, the 1.0000 parity level and the yearly low of 0.9952 will be in focus.

Overall, EUR/USD buyers are in the driver’s seat but the road to the north appears bumpy.

EUR/USD: Daily chart

Trend: Limited upside expected

Additional important levels

Overview
Today last price 1.026
Today Daily Change 0.0000
Today Daily Change % 0.00%
Today daily open 1.026
 
Trends
Daily SMA20 1.0212
Daily SMA50 1.0329
Daily SMA100 1.0525
Daily SMA200 1.0896
 
Levels
Previous Daily High 1.0328
Previous Daily Low 1.0238
Previous Weekly High 1.0369
Previous Weekly Low 1.0159
Previous Monthly High 1.0486
Previous Monthly Low 0.9952
Daily Fibonacci 38.2% 1.0272
Daily Fibonacci 61.8% 1.0293
Daily Pivot Point S1 1.0223
Daily Pivot Point S2 1.0186
Daily Pivot Point S3 1.0134
Daily Pivot Point R1 1.0313
Daily Pivot Point R2 1.0365
Daily Pivot Point R3 1.0402


Share: Feed news

Information on these pages contains forward-looking statements that involve risks and uncertainties. Markets and instruments profiled on this page are for informational purposes only and should not in any way come across as a recommendation to buy or sell in these assets. You should do your own thorough research before making any investment decisions. FXStreet does not in any way guarantee that this information is free from mistakes, errors, or material misstatements. It also does not guarantee that this information is of a timely nature. Investing in Open Markets involves a great deal of risk, including the loss of all or a portion of your investment, as well as emotional distress. All risks, losses and costs associated with investing, including total loss of principal, are your responsibility. The views and opinions expressed in this article are those of the authors and do not necessarily reflect the official policy or position of FXStreet nor its advertisers. The author will not be held responsible for information that is found at the end of links posted on this page.

If not otherwise explicitly mentioned in the body of the article, at the time of writing, the author has no position in any stock mentioned in this article and no business relationship with any company mentioned. The author has not received compensation for writing this article, other than from FXStreet.

FXStreet and the author do not provide personalized recommendations. The author makes no representations as to the accuracy, completeness, or suitability of this information. FXStreet and the author will not be liable for any errors, omissions or any losses, injuries or damages arising from this information and its display or use. Errors and omissions excepted.

The author and FXStreet are not registered investment advisors and nothing in this article is intended to be investment advice.

Recommended content


Recommended content

Editors’ Picks

EUR/USD holds above 1.0700 ahead of key US data

EUR/USD holds above 1.0700 ahead of key US data

EUR/USD trades in a tight range above 1.0700 in the early European session on Friday. The US Dollar struggles to gather strength ahead of key PCE Price Index data, the Fed's preferred gauge of inflation, and helps the pair hold its ground. 

EUR/USD News

USD/JPY stays above 156.00 after BoJ Governor Ueda's comments

USD/JPY stays above 156.00 after BoJ Governor Ueda's comments

USD/JPY holds above 156.00 after surging above this level with the initial reaction to the Bank of Japan's decision to leave the policy settings unchanged. BoJ Governor said weak Yen was not impacting prices but added that they will watch FX developments closely.

USD/JPY News

Gold price oscillates in a range as the focus remains glued to the US PCE Price Index

Gold price oscillates in a range as the focus remains glued to the US PCE Price Index

Gold price struggles to attract any meaningful buyers amid the emergence of fresh USD buying. Bets that the Fed will keep rates higher for longer amid sticky inflation help revive the USD demand.

Gold News

Sei Price Prediction: SEI is in the zone of interest after a 10% leap

Sei Price Prediction: SEI is in the zone of interest after a 10% leap

Sei price has been in recovery mode for almost ten days now, following a fall of almost 65% beginning in mid-March. While the SEI bulls continue to show strength, the uptrend could prove premature as massive bearish sentiment hovers above the altcoin’s price.

Read more

US core PCE inflation set to signal firm price pressures as markets delay Federal Reserve rate cut bets

US core PCE inflation set to signal firm price pressures as markets delay Federal Reserve rate cut bets

The core PCE Price Index, which excludes volatile food and energy prices, is seen as the more influential measure of inflation in terms of Fed positioning. The index is forecast to rise 0.3% on a monthly basis in March, matching February’s increase. 

Read more

Forex MAJORS

Cryptocurrencies

Signatures