EUR/USD Price Analysis: 50-day EMA, ascending triangle challenge recovery below 1.1400
- EUR/USD grinds higher after rallying the most in one month.
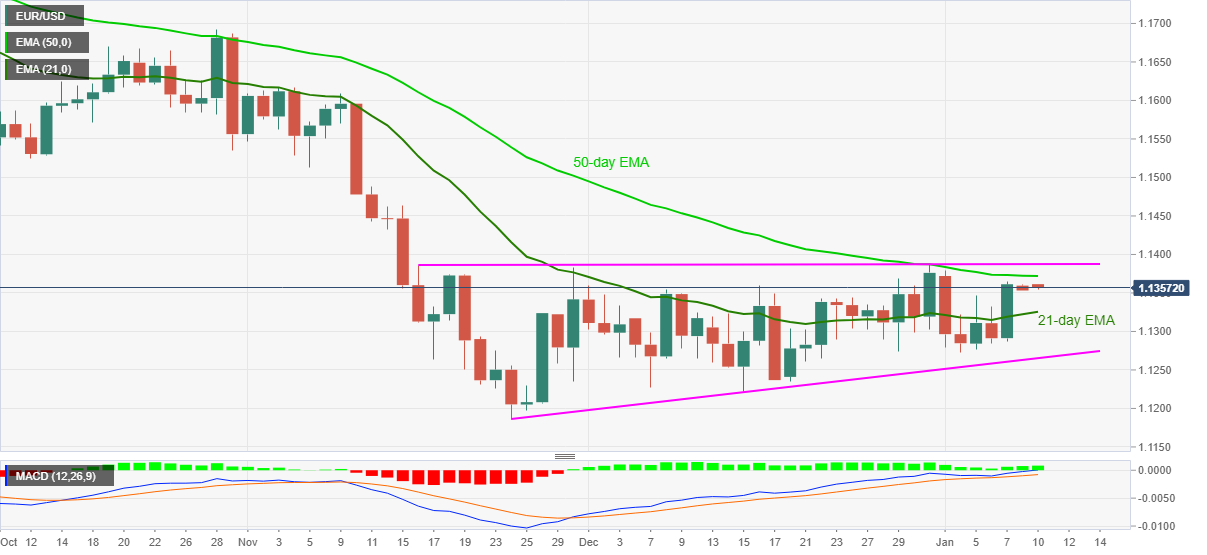
- Break of 21-day EMA, bullish MACD signals keep buyers hopeful but 50-day EMA, triangle’s resistance test the advances.
- Traders will be less interested until the quote stays between 1.1265 and 1.1385-90.

EUR/USD treads water around 1.1355-60 after posting the biggest daily gains in six weeks the previous day.
Although the quote offered a decisive break of the 21-day EMA, backed by the bullish MACD signals, EUR/USD pair traders remain cautious until the prices stay between a two-month-old ascending triangle pattern.
On an immediate basis, the envelope of the 50-day EMA and the 21-day EMA, respectively near 1.1375 and 1.1325, restricts EUR/USD moves.
However, major attention will be given to the triangle’s support and resistance lines, around 1.1265 and 1.1385-90 in that order.
Should the EUR/USD prices rise past the 1.1390 hurdle, the mid-November swing high close to 1.1465 will lure the bulls before directing them to October’s bottom surrounding 1.1525.
On the contrary, a downside break of the 1.1265 level won’t hesitate to challenge the year 2021 bottom surrounding 1.1185, a break of which will open the door for an extended south-run towards the 1.1100 psychological magnet.
Overall, EUR/USD prices are likely to remain range-bound but the bearish bias stays intact.
EUR/USD: Daily chart
Trend: Sideways
Author

Anil Panchal
FXStreet
Anil Panchal has nearly 15 years of experience in tracking financial markets. With a keen interest in macroeconomics, Anil aptly tracks global news/updates and stays well-informed about the global financial moves and their implications.


