|

EUR/USD path of least resistance is down as Q3 draws to a close – Confluence Detector

EUR/USD has been losing ground on Friday and kicks off the new week in a limited range as several figures are awaited. Where next for the world's most popular currency pair in the last full week of the third quarter? 

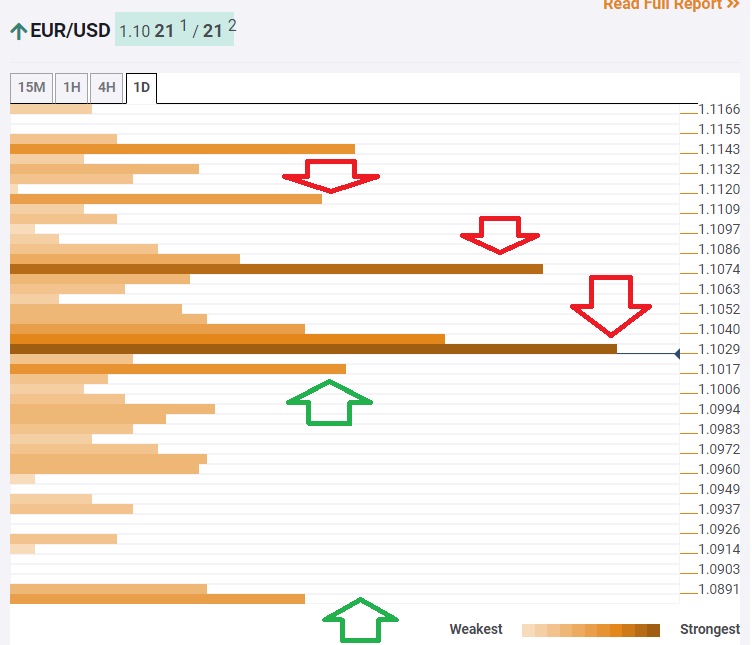
The Technical Confluences Indicator is showing that EUR/USD is capped around 1.1029, which is a dense cluster of technical lines including the Simple Moving Average 10-15m, the Fibonacci 38.2% one-day, the previous 4h-high, the Fibonacci 38.2% one-week, the SMA 100-15m, the SMA 100-4h, the Fibonacci 23.6% one-month, the SMA 10-4h, the SMA 5-1d, and more. 

Further up, another significant cap awaits the currency pair at 1.1074, which is the convergence of the Pivot Point one-week Resistance 1, and the Fibonacci 38.2% one-month. 

The next upside target it 1.1015, which is the meeting point of the BB `d-Upper, the SMA 50-1d, and the Fibonacci 161.6% one-day.

Some support awaits at 1.1017, which is the confluence of the Fibonacci 23.6% one-day, the Fibonacci 23.6% one-week, the SMA 5-4h, and the BB 15min-: Lower.

However, more significant support is only at 1.0891, where the PP 1m-S1 and the PP 1w-S3 hit the price. 

All in all, the path of least resistance is down.

Here is how it looks on the tool:

EUR USD September 23 2019 technical confluence

Confluence Detector

The Confluence Detector finds exciting opportunities using Technical Confluences. The TC is a tool to locate and point out those price levels where there is a congestion of indicators, moving averages, Fibonacci levels, Pivot Points, etc. Knowing where these congestion points are located is very useful for the trader, and can be used as a basis for different strategies.

This tool assigns a certain amount of “weight” to each indicator, and this “weight” can influence adjacents price levels. These weightings mean that one price level without any indicator or moving average but under the influence of two “strongly weighted” levels accumulate more resistance than their neighbors. In these cases, the tool signals resistance in apparently empty areas.

Learn more about Technical Confluence

Author

Yohay Elam

Yohay Elam

FXStreet

Yohay is in Forex since 2008 when he founded Forex Crunch, a blog crafted in his free time that turned into a fully-fledged currency website later sold to Finixio.

More from Yohay Elam
Share:

Editor's Picks

AUD/USD falls to near 0.7100 after slipping below 50-day EMA

AUD/USD depreciates after registering minor gains in the previous day, trading around 0.7120 during the Asian hours. The technical analysis of the daily chart shows the pair consolidating sideways within a rectangle pattern, as neither bulls nor bears gain control. The AUD/USD pair is holding a slight bearish tone however as it sits beneath both the nine-day and 50-day EMAs.

160.00: USD/JPY back near intervention territory after upbeat US jobs report

US Nonfarm Payrolls beat expectations by a wide margin in May, with 172K jobs added. The US Dollar rebounds after the release, helping USD/JPY recover from its intraday lows. Warnings from Japanese authorities continue to limit upside potential near the 160.00 threshold.

Gold targets $4,300 amid stronger Dollar

Gold faces increasing selling interest and navigates the area of three-month lows near the $4,300 mark per troy ounce on Friday. The precious metal’s decline comes as traders assess the stronger-than-expected NFP, while the bid bias in the Greenback and higher US Treasury yields also collaborate with the retracement.

Cardano hits five-year low even as Hoskinson clarifies "break" isn't an exit

Cardano (ADA) price is down 10% at press time on Friday, extending losses over 30% so far this week amid Charles Hoskinson's clarification that "break" isn't an exit.

Week ahead – Fed countdown begins amid US inflation data and geopolitical risks

Fed Chair Warsh’s first meeting approaches as key US inflation data could reshape expectations. Oil prices remain elevated as US-Iran talks continue; tariffs also return to the spotlight. ECB is expected to hike; will it be a one-off move or is July live?

The US economy defies the rules: 100 days into the Oil shock and the recession signal is still missing

More than three months after the start of the Iran war and the resulting disruption to global energy markets, the US economy continues to display remarkable resilience. The conflict has triggered a sharp rise in Oil prices, reignited inflationary pressures and fueled widespread concerns about a potential economic slowdown.