- EUR/SEK struggles to defend the previous day’s corrective bounce off weekly low.
- Bearish chart formation, likely disappointment from Eurozone inflation keep Krona buyers hopeful.
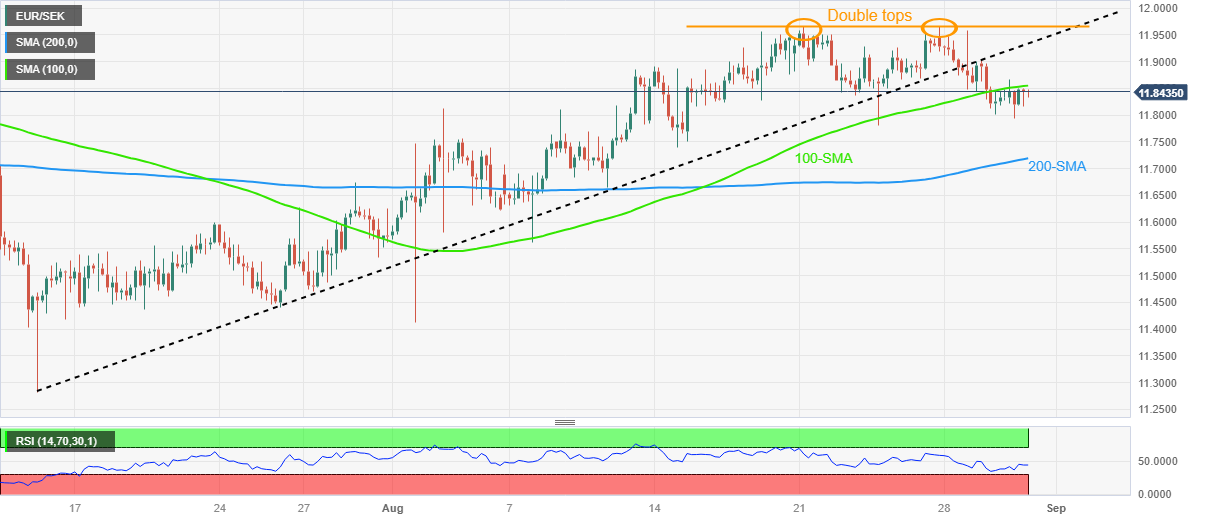
- Sellers need validation from 11.77, 200-SMA and EU HICP data for August.
EUR/SEK remains sidelined as buyers poke the 100-SMA hurdle heading into Thursday’s European session. In doing so, the Swedish Krona (SEK) pair edges higher around 11.85 as markets await the key Eurozone inflation data amid fears of witnessing a sooner policy pivot from the European Central Bank (ECB).
As a result, the first readings of the Eurozone Consumer Price Index (CPI) for August will join the ECB’s favorite inflation gauge, namely the Harmonized Index of Consumer Prices (HICP), to direct intraday moves of the EUR/SEK pair.
Given the recent challenges for the global central bankers, a surprise positive in the inflation numbers may allow the EUR/SEK to cross the immediate 100-SMA hurdle of 11.85.
Following that, a seven-week-old previous support line surrounding 11.93 and the double tops around 11.96 will test the Swedish Krona (SEK) sellers before directing them to the 12.00 threshold.
On the flip side, a clear break of the previous weekly low surrounding 11.77 will confirm the “double tops” bearish chart formation suggesting the theoretical slump toward 11.58. However, the 200-SMA level of around 11.71 may act as an intermediate halt during the theoretically expected fall.
EUR/SEK: Four-hour chart
Trend: Further downside expected
Information on these pages contains forward-looking statements that involve risks and uncertainties. Markets and instruments profiled on this page are for informational purposes only and should not in any way come across as a recommendation to buy or sell in these assets. You should do your own thorough research before making any investment decisions. FXStreet does not in any way guarantee that this information is free from mistakes, errors, or material misstatements. It also does not guarantee that this information is of a timely nature. Investing in Open Markets involves a great deal of risk, including the loss of all or a portion of your investment, as well as emotional distress. All risks, losses and costs associated with investing, including total loss of principal, are your responsibility. The views and opinions expressed in this article are those of the authors and do not necessarily reflect the official policy or position of FXStreet nor its advertisers. The author will not be held responsible for information that is found at the end of links posted on this page.
If not otherwise explicitly mentioned in the body of the article, at the time of writing, the author has no position in any stock mentioned in this article and no business relationship with any company mentioned. The author has not received compensation for writing this article, other than from FXStreet.
FXStreet and the author do not provide personalized recommendations. The author makes no representations as to the accuracy, completeness, or suitability of this information. FXStreet and the author will not be liable for any errors, omissions or any losses, injuries or damages arising from this information and its display or use. Errors and omissions excepted.
The author and FXStreet are not registered investment advisors and nothing in this article is intended to be investment advice.
Recommended content
Editors’ Picks
EUR/USD clings to gains above 1.0750 after US data

EUR/USD manages to hold in positive territory above 1.0750 despite retreating from the fresh multi-week high it set above 1.0800 earlier in the day. The US Dollar struggles to find demand following the weaker-than-expected NFP data.
GBP/USD declines below 1.2550 following NFP-inspired upsurge

GBP/USD struggles to preserve its bullish momentum and trades below 1.2550 in the American session. Earlier in the day, the disappointing April jobs report from the US triggered a USD selloff and allowed the pair to reach multi-week highs above 1.2600.
Gold struggles to hold above $2,300 despite falling US yields

Gold stays on the back foot below $2,300 in the American session on Friday. The benchmark 10-year US Treasury bond yield stays in negative territory below 4.6% after weak US data but the improving risk mood doesn't allow XAU/USD to gain traction.
Bitcoin Weekly Forecast: Should you buy BTC here? Premium

Bitcoin (BTC) price shows signs of a potential reversal but lacks confirmation, which has divided the investor community into two – those who are buying the dips and those who are expecting a further correction.
Week ahead – BoE and RBA decisions headline a calm week

Bank of England meets on Thursday, unlikely to signal rate cuts. Reserve Bank of Australia could maintain a higher-for-longer stance. Elsewhere, Bank of Japan releases summary of opinions.