|

EUR/JPY Price Analysis: Wave C of a bearish Measured Move unfolds

  • EUR/JPY continues declining and has formed a bearish pattern called a Measured Move. 
  • It is composed of three waves – wave C appears to be in mid development.
  • The bearish 4-hour chart echoes weak technicals observed on the weekly chart.  

EUR/JPY is down over a third of a percent, trading in the 163.70s on Wednesday, on the back of a mixture of probable intervention by the Japanese authorities to strengthen the Japanese Yen (JPY) and more dovish commentary from rate-setters at the European Central Bank (ECB).  

The 4-hour chart is showing a bearish ABC Measured Move pattern forming which looks like it probably still has lower to go. 

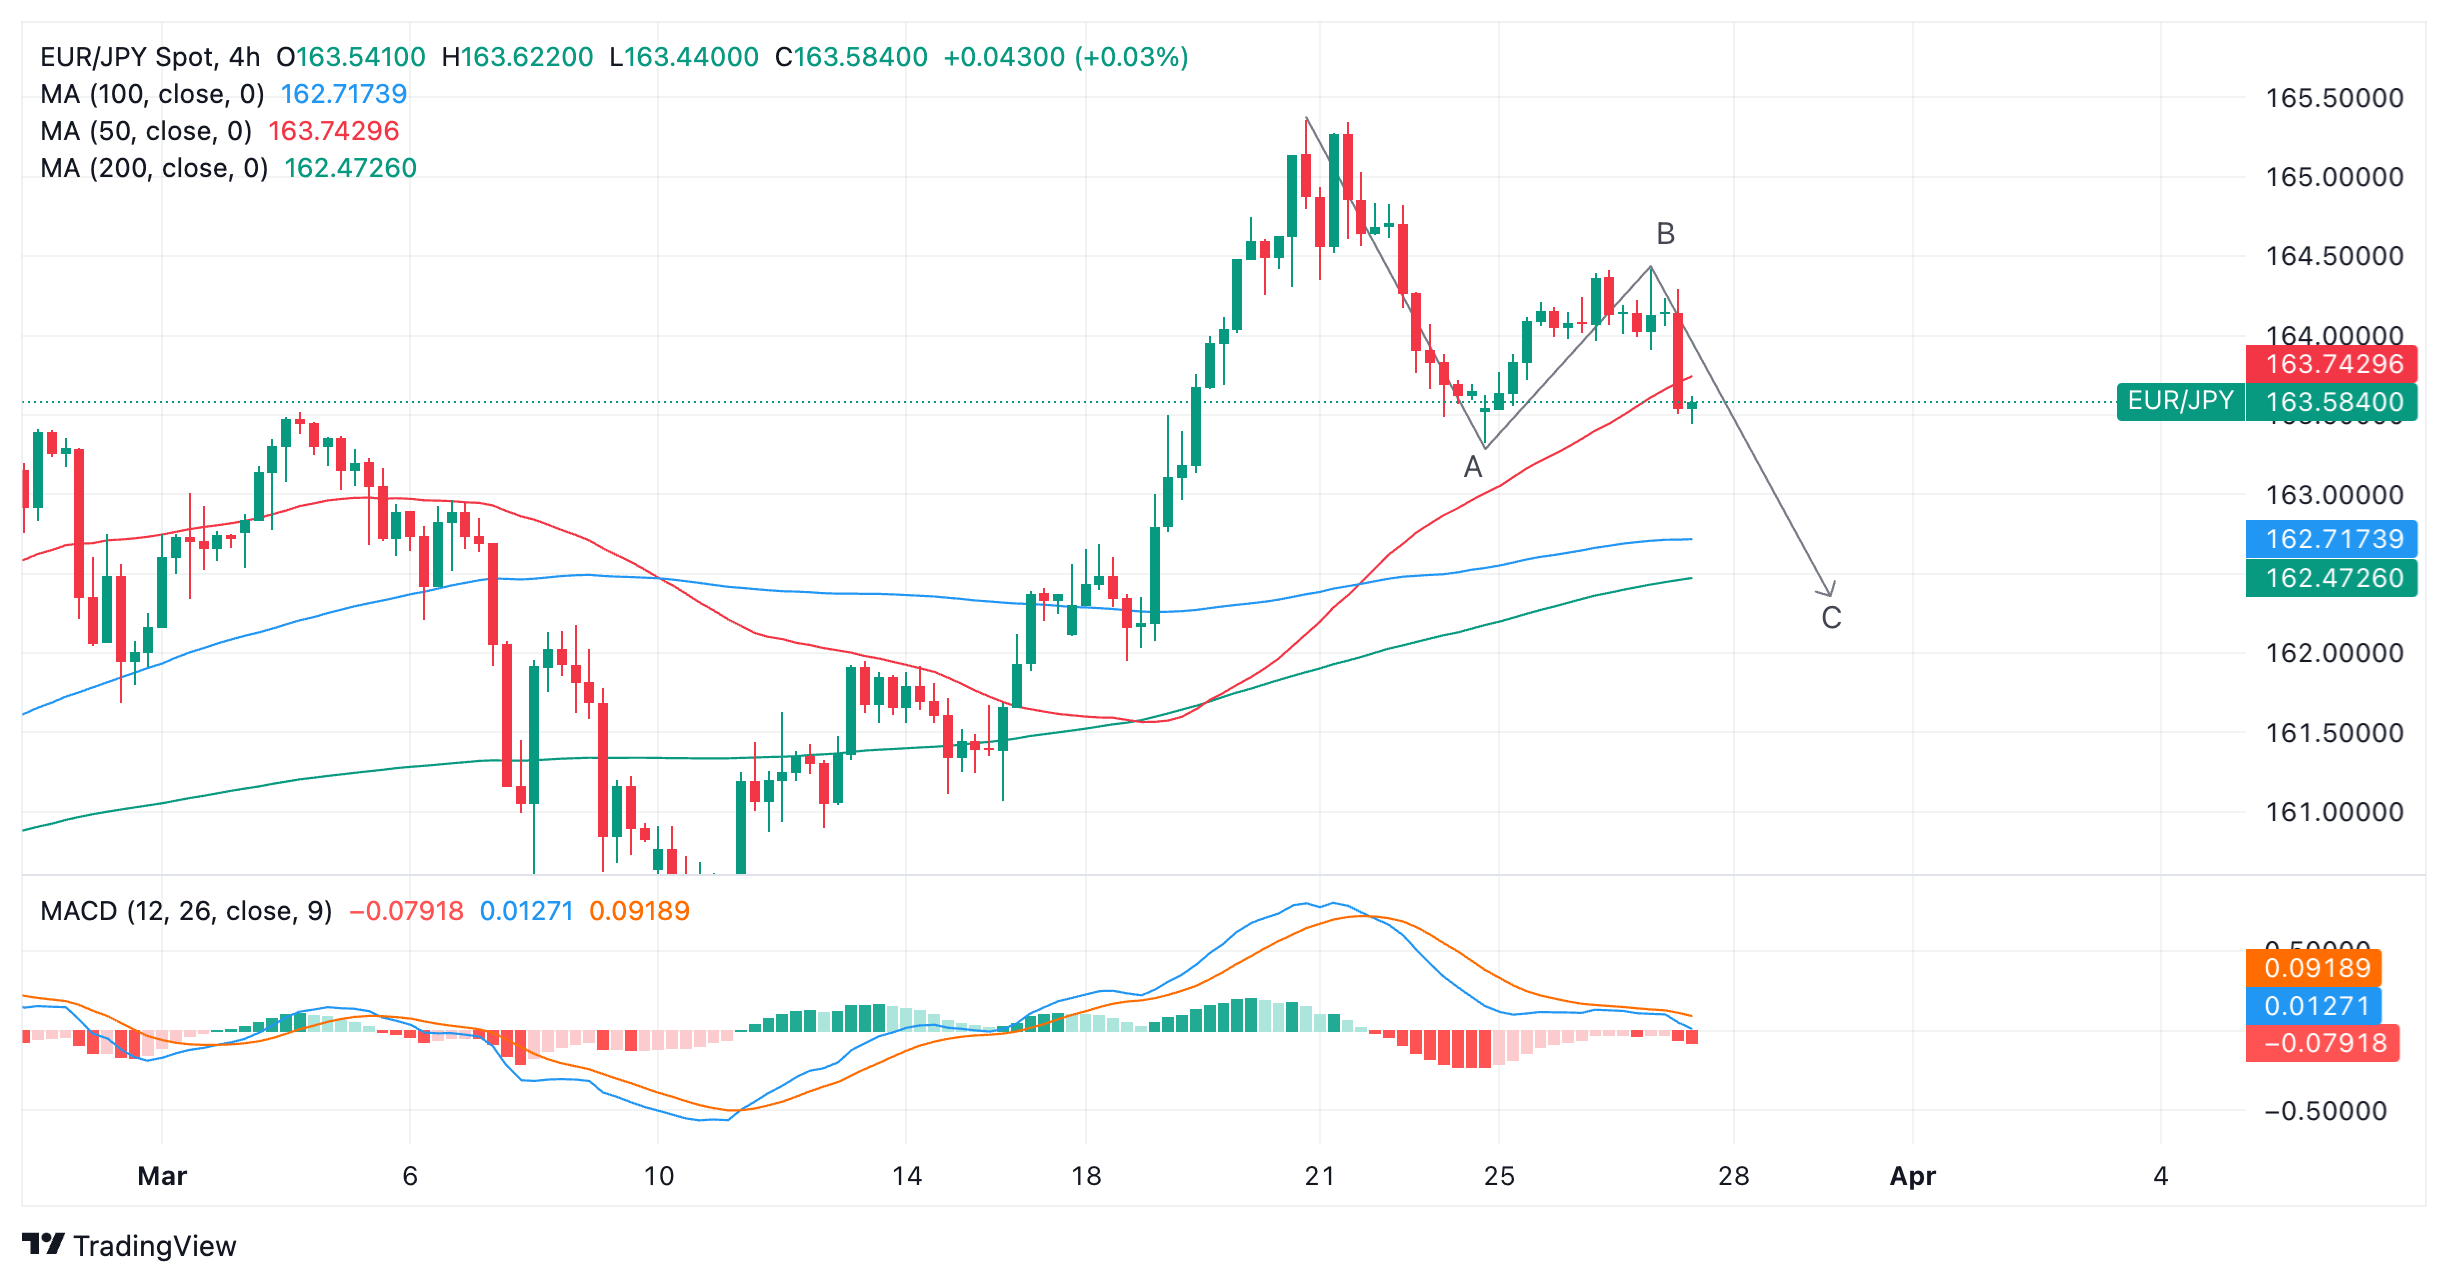
Euro versus Japanese Yen: 4-hour chart

If wave C is the same length as wave A, which is often the case, the Measured Move could stretch down to a target situated at about 162.40, just below the 200-4hr Simple Moving Average (SMA). 

The pair has just completed a long red bearish Marubozu Japanese candlestick pattern which adds a further bearish tone to the chart. Even if there is a pullback after the sell-off it will probably only go as high as the midpoint of the Marubozu candle at 163.90 before probably continuing lower. 

The short-term trend remains unclear but a break below the lows of wave A at 163.32 would provide confirmation shifting the odds in favor of a downtrend and a continuation of wave C. 

The acute bearish divergence with the Relative Strength Indicator (RSI) on the Weekly chart as reported in a previous article, is further evidence supporting more downside.

Author

Joaquin Monfort

Joaquin Monfort is a financial writer and analyst with over 10 years experience writing about financial markets and alt data. He holds a degree in Anthropology from London University and a Diploma in Technical analysis.

More from Joaquin Monfort
Share:

Markets move fast. We move first.

Orange Juice Newsletter brings you expert driven insights - not headlines. Every day on your inbox.

By subscribing you agree to our Terms and conditions.

Editor's Picks

EUR/USD eyes 1.1800 barrier near two-month highs

EUR/USD extends its gains for the second successive session, trading around 1.1780 during the Asian hours on Tuesday. On the daily chart, technical analysis indicates a persistent bullish bias, as the pair moves upward within the ascending channel pattern. Additionally, the 14-day Relative Strength Index at 68.89 sits near overbought, signaling strong demand. RSI remains elevated, which could cap gains if overbought conditions emerge.

GBP/USD knocks ten-week highs ahead of holiday slowdown

GBP/USD found room on the high side on Monday, kicking off a holiday-shortened trading week with a fresh spat of Greenback weakness, bolstering the Pound Sterling into its highest bids in ten weeks. Pound traders are largely brushing off the latest interest rate cut from the Bank of England as the UK’s central bank policy strategy leaves the water murky for rate-cut watchers.

Gold bulls seem unstoppable amid supportive fundamental backdrop

Gold is seen building on the previous day's strong rally of over 2% and continues scaling new all-time highs for the second consecutive day on Tuesday. The commodity climbs closer to the $4,500 psychological mark during the Asian session and remains well supported by a combination of factors. 

Uniswap holds above $6 as traders eye UNIfication vote outcome

Uniswap price holds above $6 at the time of writing on Tuesday after closing above a key resistance zone in the previous week. Traders are focusing on the highly anticipated UNIfication proposal, which is set to conclude on Thursday, and could become a key near-term catalyst. On the technical side, momentum indicators are flashing bullish signals, hinting at an upside rally.

Ten questions that matter going into 2026

2026 may be less about a neat “base case” and more about a regime shift—the market can reprice what matters most (growth, inflation, fiscal, geopolitics, concentration). The biggest trap is false comfort: the same trades can look defensive… right up until they become crowded.

XRP steadies above $1.90 support as fund inflows and retail demand rise

Ripple (XRP) is stable above support at $1.90 at the time of writing on Monday, after several attempts to break above the $2.00 hurdle failed to materialize last week. Meanwhile, institutional interest in the cross-border remittance token has remained steady.