|

EUR/JPY Price Analysis: Bearish divergence hints at further weakness

  • EUR/JPY is showing acute bearish divergence on the weekly chart compared to 2023. 
  • This indicates the potential for a pullback on the horizon. 
  • A negative close next week would provide further evidence of a correction forming.

EUR/JPY is in a long-term uptrend distinguished by the rising peaks and troughs in price on the weekly chart.

The pair’s price has formed a bearish divergence with the Relative Strength Index (RSI) in the current week when compared with the similar high in November 2023. 

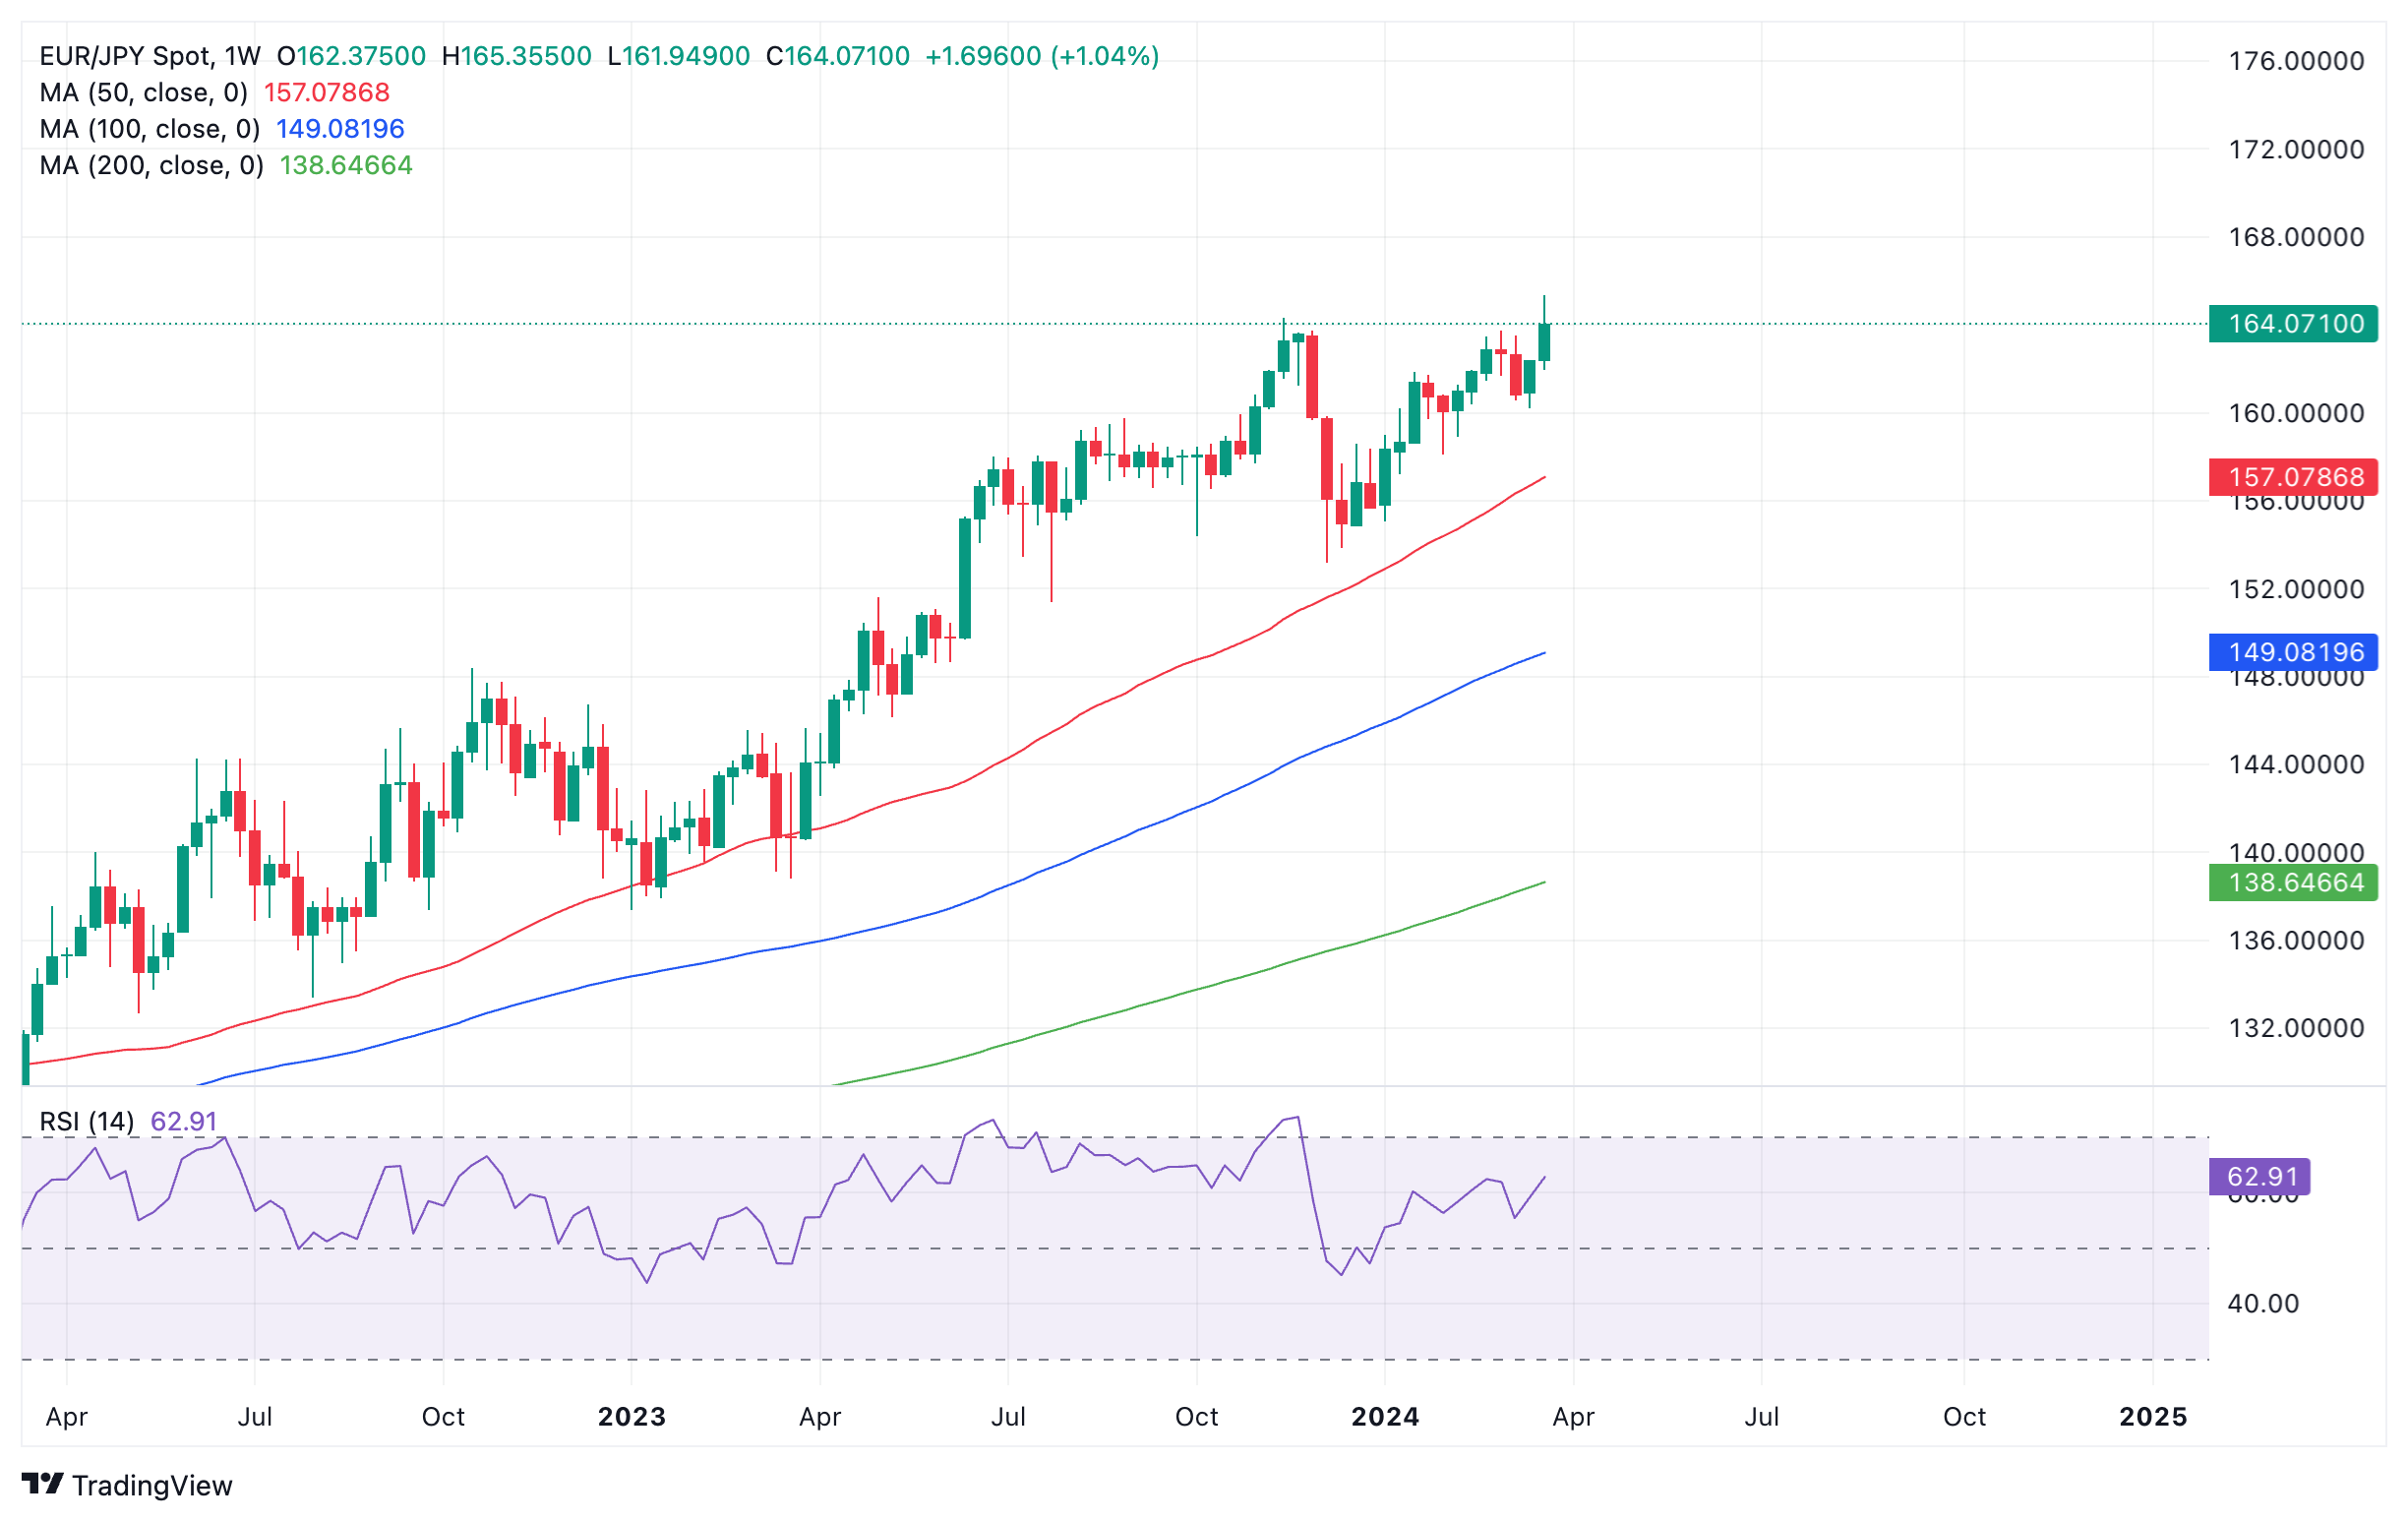
Euro versus Japanese Yen: Weekly chart

Divergence occurs when price reaches a higher high but the RSI fails to follow. It is a sign of underlying weakness in the asset price and a precursor to a possible correction. In the case of EUR/JPY the new multi-year high reached this week was not accompanied by a higher high in the RSI when compared with the high in November 2023. 

The divergence is quite acute suggesting a stronger possibility it could indicate a subsequent bearish pullback in price.  

A natural target for a pullback if it develops would be the red 50-week Simple Moving Average (SMA) at 157.080. 

If the next week is bearish that would add credence to the view there will be a correction signaled by the divergence.

Author

Joaquin Monfort

Joaquin Monfort is a financial writer and analyst with over 10 years experience writing about financial markets and alt data. He holds a degree in Anthropology from London University and a Diploma in Technical analysis.

More from Joaquin Monfort
Share:

Editor's Picks

EUR/USD: Bears retain control below 1.1780-1.1770 confluence breakpoint

The EUR/USD pair remains on the back foot through the Asian session on Friday and currently trades just above mid-1.1700s, well within striking distance of a nearly one-month low set the previous day.

GBP/USD seems vulnerable near one-month low as traders await US data

The GBP/USD pair prolongs its weekly downtrend for the fifth consecutive day on Friday and slides back closer to a nearly one-month low, touched the previous day. Spot prices trade below mid-1.3400s during the Asian session on Friday and seem vulnerable to slide further as traders now look to important US macro data for a fresh impetus.

Gold eyes next breakout on US GDP, PCE inflation data

Gold sticks to recent gains around the $5,000-mark early Friday, biding time before the high-impact US macro events. The focus is now on the US fourth-quarter Gross Domestic Product, core Personal Consumption Expenditures Price Index and the Supreme Court’s ruling on President Donald Trump’s tariffs.

Bitcoin, Ethereum and Ripple remain range-bound as breakdown risks rise

Bitcoin, Ethereum, and Ripple are trading sideways within consolidation ranges on Friday, signaling a lack of directional bias in the broader crypto market. BTC rebounded from key support, and ETH is nearing the lower consolidation boundary, while XRP is holding at its lower trendline boundary. 

Hawkish Fed minutes and a market finding its footing

It was green across the board for US Stock market indexes at the close on Wednesday, with most S&P 500 names ending higher, adding 38 points (0.6%) to 6,881 overall. At the GICS sector level, energy led gains, followed by technology and consumer discretionary, while utilities and real estate posted the largest losses.

Official Trump price approaches breakout with mixed signals from traders

Official Trump (TRUMP) is trading at $3.50 at the time of writing, approaching its upper consolidation range. A breakout from this range could open the door for an upside move. On-chain data shows market indecision, with balanced flows between bulls and bears, signaling a lack of clear directional bias.