|

EUR/JPY Price Analysis: Upside stalled just ahead of the 200-day SMA

  • EUR/JPY trims gains after testing the key 200-day SMA near 120.30.
  • The cross remains volatile and keeps looking to risk trends for direction.

Volatility has picked up around EUR/JPY on Monday, always looking to developments from the Chinese coronavirus for near-term direction.

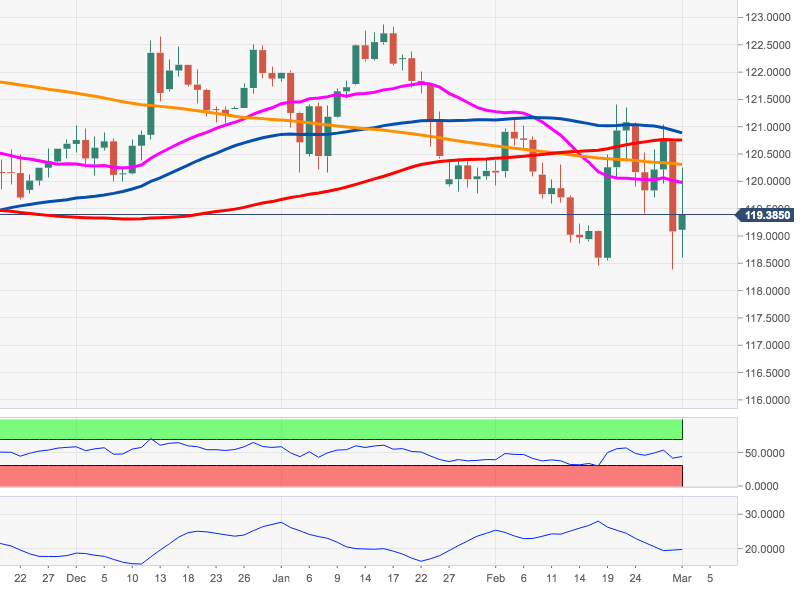
The daily price action saw a test of the boundaries of the 120.30 region, where sits the 200-day SMA, and the proximity of 118.50, area close to the 2020 lows recorded on Friday.

While the cross keeps waiting for a stronger catalyst for price direction, further consolidation should not be ruled out, likely between 121.50 and 118.50.

EUR/JPY daily chart

EUR/JPY

Overview
Today last price119.36
Today Daily Change165
Today Daily Change %0.24
Today daily open119.08
 
Trends
Daily SMA20120.01
Daily SMA50120.86
Daily SMA100120.76
Daily SMA200120.32
 
Levels
Previous Daily High120.76
Previous Daily Low118.38
Previous Weekly High121.07
Previous Weekly Low118.38
Previous Monthly High121.4
Previous Monthly Low118.38
Daily Fibonacci 38.2%119.29
Daily Fibonacci 61.8%119.85
Daily Pivot Point S1118.06
Daily Pivot Point S2117.03
Daily Pivot Point S3115.68
Daily Pivot Point R1120.43
Daily Pivot Point R2121.78
Daily Pivot Point R3122.81

Author

Pablo Piovano

Born and bred in Argentina, Pablo has been carrying on with his passion for FX markets and trading since his first college years.

More from Pablo Piovano
Share:

Editor's Picks

EUR/USD slumps below 1.1750 as USD benefits from risk-aversion

EUR/USD comes under renewed bearish pressure in the European session and trades below 1.1750 following a recovery attempt earlier in the day. The US Dollar gathers strength and weighs on the pair as investors seek refuge in the wake of Israel and the United States' joint attack on Iran.

GBP/USD targets 1.3500 barrier near moving averages

GBP/USD rebounds from the daily losses, trading around 1.3450 during the Asian hours on Monday. The technical analysis of the daily chart indicates an ongoing bearish bias, as the pair trades within a descending channel pattern.

Gold surges on safe-haven demand, tests $5,400

Gold benefits from intense risk-aversion on Monday and climbs to the $5,400 region, setting a fresh monthly-high in the process. Tensions in the Middle East remain high as Israel and Hezbollah continue to exchange strikes following the US-Israel joint attack on Iran over the weekend.

Bitcoin on brink of breakdown amid US-Iran war

Bitcoin (BTC) remains under pressure near the key support level of $65,700. Trading at $66,400 at the time of writing on Monday, a breakdown below this critical level would suggest a deeper correction ahead.

The week ahead: Conflict in the Middle East jolts markets

Events in the Middle East are obviously dominating financial markets this morning. The Brent crude oil price is extending gains and is higher by more than 8%, stock futures are pointing lower and the gold price is higher by more than 2%. 

Pi Network Price Forecast: Core team offloads supply, weighing on PI recovery

Pi Network  hovers below $0.1700, broadly steady at press time on Monday, attempting a recovery after a 2% loss the previous day. Sunday’s decline aligned with nearly 49 million PI tokens offloaded by the Pi Foundation, implying a spike in supply pressure that capped the prevailing four-day recovery.