|

EUR/JPY Price Analysis: The 162.00 mark looms closer

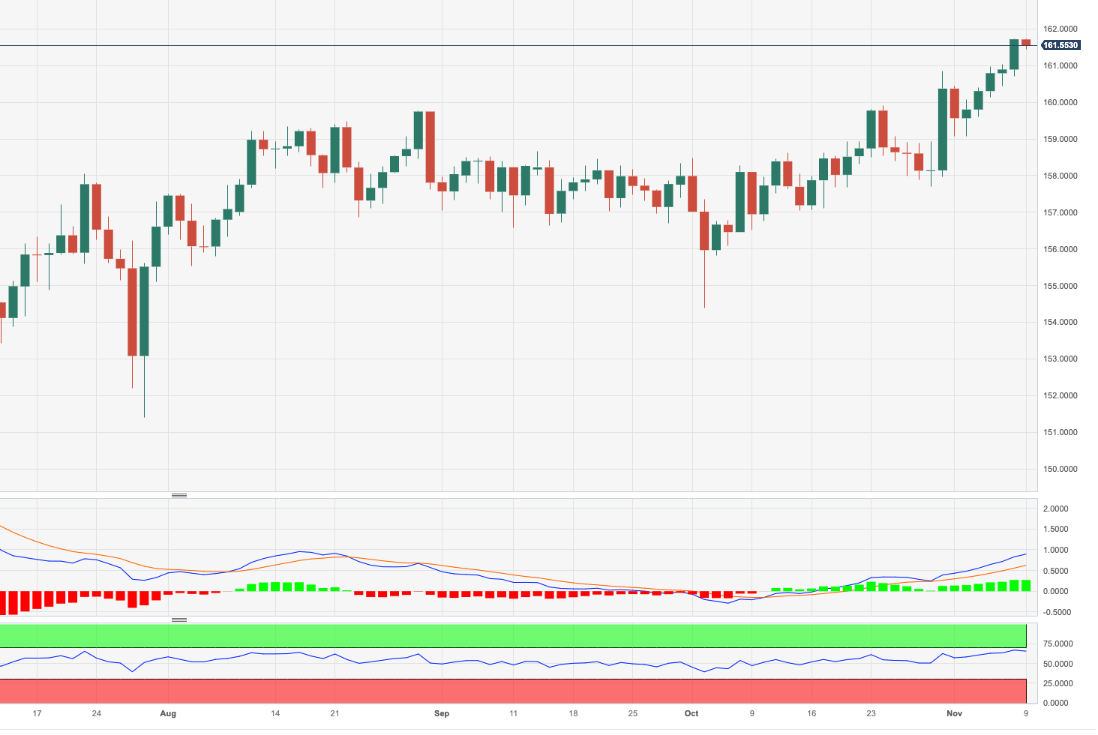
  • EUR/JPY prints fresh tops near 161.70 on Thursday.
  • Extra gains could advance to the 2008 top near 170.00.

EUR/JPY struggles to advance further despite printing new YTD peaks in the 161.70/75 band on Thursday.

Further upside appears well on the cards for the cross in the short-term horizon. Against that, the surpass of the 2023 high of 161.74 (November 9) is expected to face the next significant resistance level not before the 2008 top of 169.96 (July 23)

So far, the longer term positive outlook for the cross appears favoured while above the 200-day SMA, today at 152.03.

EUR/JPY daily chart

EUR/JPY

Overview
Today last price161.56
Today Daily Change30
Today Daily Change %-0.10
Today daily open161.72
 
Trends
Daily SMA20159.1
Daily SMA50158.22
Daily SMA100157.63
Daily SMA200151.97
 
Levels
Previous Daily High161.73
Previous Daily Low160.7
Previous Weekly High160.85
Previous Weekly Low157.7
Previous Monthly High160.85
Previous Monthly Low154.39
Daily Fibonacci 38.2%161.34
Daily Fibonacci 61.8%161.09
Daily Pivot Point S1161.04
Daily Pivot Point S2160.35
Daily Pivot Point S3160
Daily Pivot Point R1162.07
Daily Pivot Point R2162.42
Daily Pivot Point R3163.1

Author

Pablo Piovano

Born and bred in Argentina, Pablo has been carrying on with his passion for FX markets and trading since his first college years.

More from Pablo Piovano
Share:

Editor's Picks

AUD/USD eyes 0.7150 barrier nine-day EMA

AUD/USD inches higher after registering modest losses in the previous day, trading around 0.7130 during the Asian hours. The technical analysis of the daily chart indicates that the pair is moving sideways within the rectangle pattern, suggesting a consolidation as neither the bulls nor the bears have enough momentum to take control of the market.

USD/JPY trades below 160.00 intervention threshold; bullish bias intact

The USD/JPY pair attracts some sellers during the Asian session amid fears that authorities will step in again to prop up the Japanese Yen. Furthermore, the Israel-Lebanon truce prompts some profit-taking around the US Dollar and exerts downward pressure on the currency pair.

Gold defends 200-day SMA at $4,425, but for how long?

Gold is attempting a tepid recovery toward $4,500 early Thursday, as renewed optimism in the Mideast geopolitical front calms market nerves. This cautious optimism across Asian markets weighs on Oil prices, and diminishes the US Dollar’s safe-haven appeal, helping Gold stage a decent comeback from the weekly low of $4,424.


Hyperliquid: ETF demand, capital rotation fuel HYPE rally as Bitcoin melts

Hyperliquid price sustains an upward trend near its all-time high of $75.76 on Thursday after posting 80% gains in May, while Bitcoin (BTC) retraces below $65,000, triggering a market-wide panic.

Kevin Warsh takes the Fed helm: What it means for the US Dollar
The Federal Reserve moves away from the highly predictable "forward guidance" model of the Jerome Powell era to a new “Kevin Warsh environment”, characterized by less communication, more policy surprises, and an increased focus on the Fed's complex balance sheet.
Recession on paper: What really moves the Canadian Loonie now?

Statistics Canada handed the headline writers a gift and the analysts a headache. Real GDP shrank 0.1% on an annualized basis in the first quarter, and with the fourth quarter of 2025 revised down to a 1.0% contraction, that is two negative quarters in a row, the textbook definition of a technical recession and Canada's first since the pandemic.