EUR/JPY Price Analysis: Remains bearish after posting recovery from three-week low


  • EUR/JPY bounces from three-week low to 161.96, forming a 'hammer' pattern suggesting potential upside.
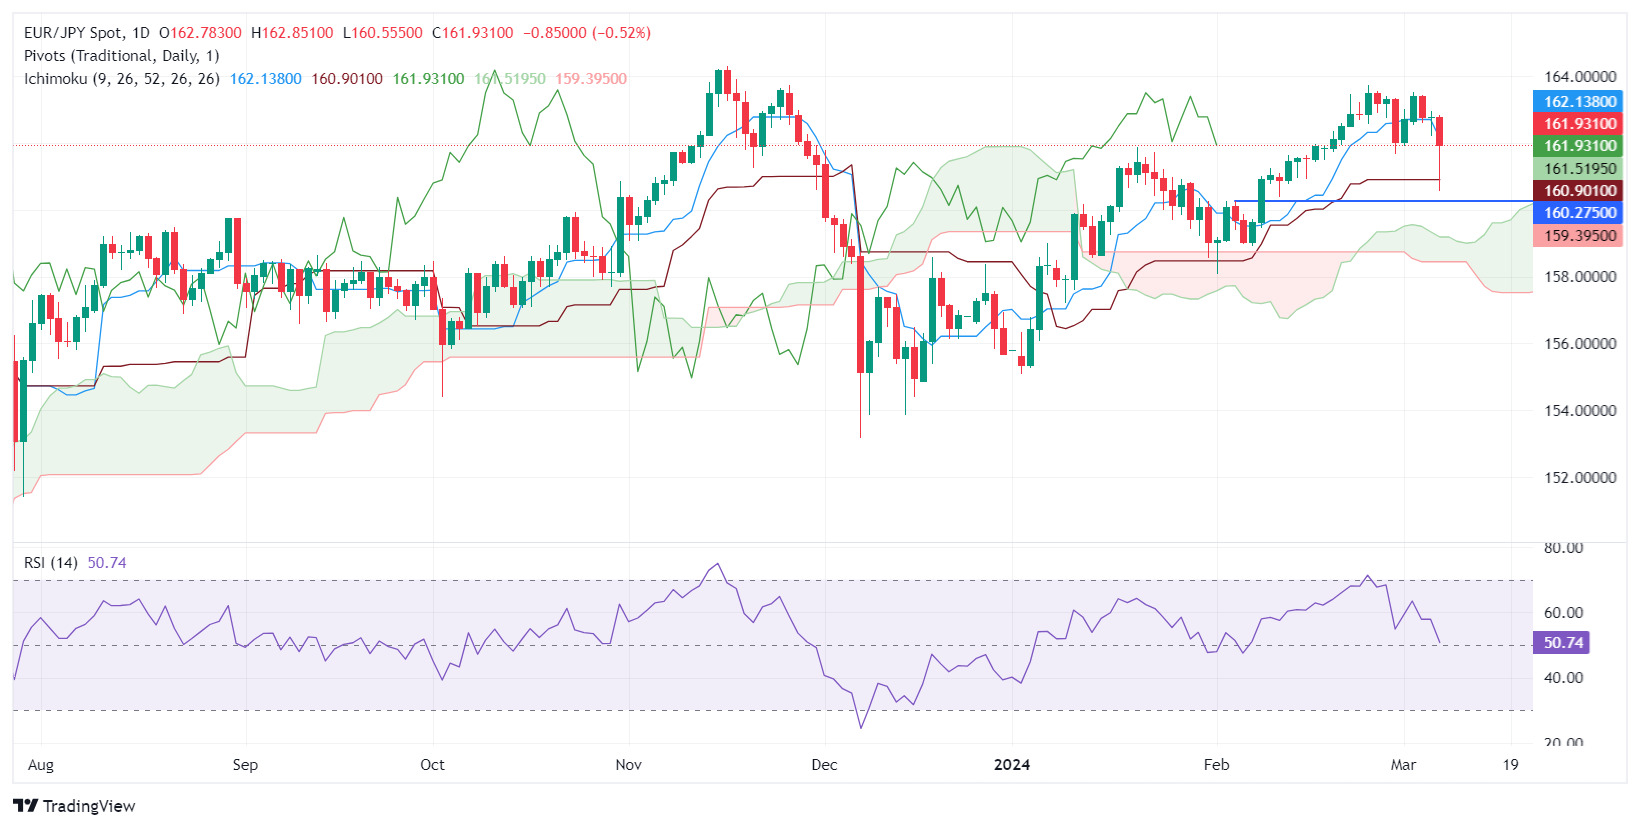
  • Mixed technical indicators prompt caution, with the RSI nearing a bearish shift as the pair eyes the 162.04 Tenkan-Sen.
  • Bears and bulls vie for control, with critical supports and resistances set around key psychological and technical marks.

On Thursday, the EUR/JPY registered a volatile session that saw the pair dive to a three-week low of 160.55. However, the losses were short-lived amidst the ECB’s hawkish hold, and the session finished with losses of 0.43%. As the Friday Asian session begins, the cross trades at 161.96, down 0.10%.

EUR/JPY Price Analysis: Technical outlook

The EUR/JPY formed a 230 pip ‘hammer,’ which indicates the pair is edged to the upside. However, mixed signals between price action and the Relative Strength Index (RSI) are closing to the 50-midline about to shift bearish, suggesting caution is warranted.

On the upside, the pair is capped by the Tenkan-Sen at 162.04, which, once cleared, could open the door to testing the March 7 high at 162.81, followed by the psychological 163.00 mark. Nevertheless, should bears keep the EUR/JPY from climbing above 162.00, the pair could extend its losses.

The first support would be the Senkou Span A at 161.67, followed by the Kijun-Sen at 161.31. Once surpassed, the 160.55 March 7 low emerges as the demand area, followed by 160.00.

EUR/JPY Price Action – Daily Chart

EUR/JPY

Overview
Today last price 162
Today Daily Change -0.78
Today Daily Change % -0.48
Today daily open 162.78
 
Trends
Daily SMA20 162.26
Daily SMA50 160.38
Daily SMA100 159.99
Daily SMA200 158.22
 
Levels
Previous Daily High 162.96
Previous Daily Low 162.21
Previous Weekly High 163.72
Previous Weekly Low 161.68
Previous Monthly High 163.72
Previous Monthly Low 158.08
Daily Fibonacci 38.2% 162.67
Daily Fibonacci 61.8% 162.5
Daily Pivot Point S1 162.34
Daily Pivot Point S2 161.9
Daily Pivot Point S3 161.59
Daily Pivot Point R1 163.09
Daily Pivot Point R2 163.4
Daily Pivot Point R3 163.84


Share: Feed news

Information on these pages contains forward-looking statements that involve risks and uncertainties. Markets and instruments profiled on this page are for informational purposes only and should not in any way come across as a recommendation to buy or sell in these assets. You should do your own thorough research before making any investment decisions. FXStreet does not in any way guarantee that this information is free from mistakes, errors, or material misstatements. It also does not guarantee that this information is of a timely nature. Investing in Open Markets involves a great deal of risk, including the loss of all or a portion of your investment, as well as emotional distress. All risks, losses and costs associated with investing, including total loss of principal, are your responsibility. The views and opinions expressed in this article are those of the authors and do not necessarily reflect the official policy or position of FXStreet nor its advertisers. The author will not be held responsible for information that is found at the end of links posted on this page.

If not otherwise explicitly mentioned in the body of the article, at the time of writing, the author has no position in any stock mentioned in this article and no business relationship with any company mentioned. The author has not received compensation for writing this article, other than from FXStreet.

FXStreet and the author do not provide personalized recommendations. The author makes no representations as to the accuracy, completeness, or suitability of this information. FXStreet and the author will not be liable for any errors, omissions or any losses, injuries or damages arising from this information and its display or use. Errors and omissions excepted.

The author and FXStreet are not registered investment advisors and nothing in this article is intended to be investment advice.

Recommended content


Recommended content

Editors’ Picks

AUD/USD retargets the 0.6600 barrier and above

AUD/USD retargets the 0.6600 barrier and above

AUD/USD extended its positive streak for the sixth session in a row at the beginning of the week, managing to retest the transitory 100-day SMA near 0.6580 on the back of the solid performance of the commodity complex.

AUD/USD News

EUR/USD keeps the bullish bias above 1.0700

EUR/USD keeps the bullish bias above 1.0700

EUR/USD rapidly set aside Friday’s decline and regained strong upside traction in response to the marked retracement in the Greenback following the still-unconfirmed FX intervention by the Japanese MoF.

EUR/USD News

Gold advances for a third consecutive day

Gold advances for a third consecutive day

Gold fluctuates in a relatively tight channel above $2,330 on Monday. The benchmark 10-year US Treasury bond yield corrects lower and helps XAU/USD limit its losses ahead of this week's key Fed policy meeting.

Gold News

Bitcoin price dips to $62K range despite growing international BTC validation via spot ETFs

Bitcoin price dips to $62K range despite growing international BTC validation via spot ETFs

Bitcoin (BTC) price closed down for four weeks in a row, based on the weekly chart, and could be on track for another red candle this week. The last time it did this was in the middle of the bear market when it fell by 42% within a span of nine weeks. 

Read more

Japan intervention: Will it work?

Japan intervention: Will it work?

Dear Japan Intervenes in the Yen for the first time since November 2022 Will it work? Have we seen a top in USDJPY? Let's go through the charts.

Read more

Forex MAJORS

Cryptocurrencies

Signatures