|

EUR/JPY Price Analysis: Rebounds from 12-day low to defend 142.00 on BOJ’s status-quo

  • EUR/JPY refreshed multi-day low before bouncing off 141.14 on BOJ’s inaction.
  • BOJ kept monetary policy unchanged while meeting market expectations.
  • Two-week-old support line restricts immediate downside but 100-SMA tests buyers.
  • RSI rebound hints at the further recovery of the pair, falling wedge eyed too.

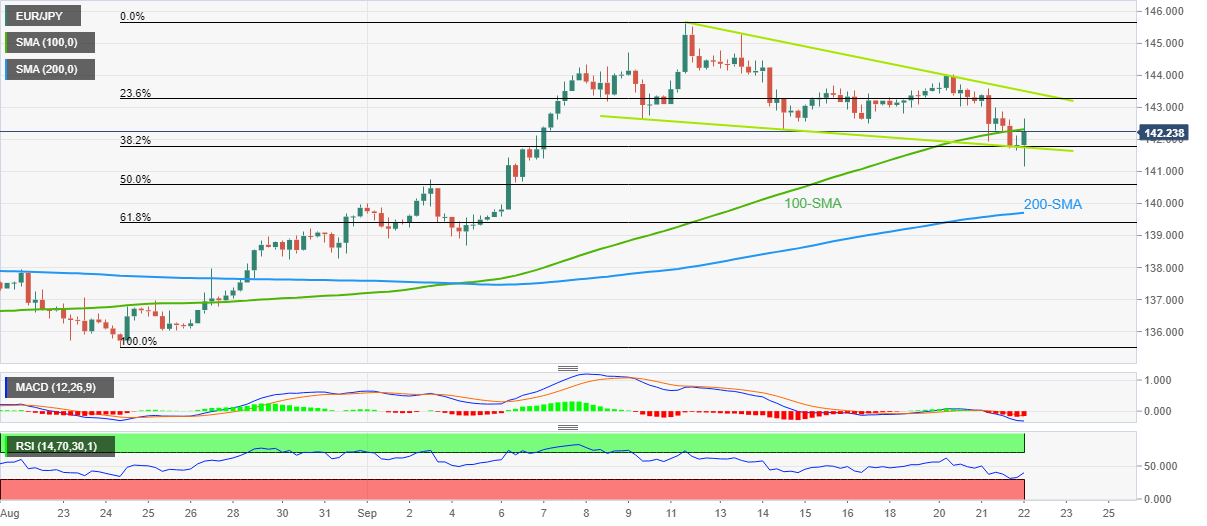
EUR/JPY picks up bids to attack 100-SMA around 142.25, following a whipsaw that refreshed the intraday bottom after the Bank of Japan’s (BOJ) monetary policy announcements on early Thursday. In doing so, the cross-currency pair rebounds from a fortnight-old support line.

BOJ kept the short-term interest rate target at -0.1% while directing 10-year Japanese Government Bond (JGB) yields toward zero, as expected, during September’s monetary policy. The Japanese central bank also concluded its pandemic relief stimulus as said, “BOJ decided to phase out pandemic funding program, shift to fund provision step that meets a wide range of financing needs.”

Given the RSI’s rebound from the oversold territory supporting the quote’s latest bounce off the short-term support line, the EUR/JPY is likely to overcome the immediate 100-SMA hurdle near 142.30.

However, the quote’s further upside hinges on the successful break of a downward sloping resistance line from September 12, around 143.60 at the latest.

That said, a clear upside break of the 143.60 hurdle will confirm the falling wedge bullish chart pattern, which in turn suggests the EUR/JPY rally towards 148.00 on a theoretical basis.

Meanwhile, a downside break of the nearly support line, also forming part of the wedge, close to 141.75, will quickly fetch the quote towards the 200-SMA support near 139.70.

EUR/JPY: Four-hour chart

Trend: Further recovery expected

Additional important levels

Overview
Today last price142.29
Today Daily Change0.54
Today Daily Change %0.38%
Today daily open141.75
 
Trends
Daily SMA20141.44
Daily SMA50139.2
Daily SMA100139.15
Daily SMA200135.49
 
Levels
Previous Daily High143.6
Previous Daily Low141.64
Previous Weekly High145.64
Previous Weekly Low142.3
Previous Monthly High139.73
Previous Monthly Low133.4
Daily Fibonacci 38.2%142.39
Daily Fibonacci 61.8%142.85
Daily Pivot Point S1141.06
Daily Pivot Point S2140.37
Daily Pivot Point S3139.1
Daily Pivot Point R1143.02
Daily Pivot Point R2144.29
Daily Pivot Point R3144.98

Author

Anil Panchal

Anil Panchal

FXStreet

Anil Panchal has nearly 15 years of experience in tracking financial markets. With a keen interest in macroeconomics, Anil aptly tracks global news/updates and stays well-informed about the global financial moves and their implications.

More from Anil Panchal
Share:

Editor's Picks

EUR/USD seems fragile below 1.1700 as Middle East war boosts energy prices

The EUR/USD pair trades flat at around 1.1680 during the Asian trading session on Tuesday, but broadly seems vulnerable, being close to its five-week low. The major currency pair is under pressure as surging oil prices due to the United States-Israel war with Iran have increased the risks of higher inflation for the Old Continent.

GBP/USD hovers around 1.3400 with bearish pressure intact

GBP/USD edges higher after three days of losses, trading around 1.3400 during the Asian hours on Tuesday. The technical analysis of the daily chart indicates an ongoing bearish bias, as the pair trades within a descending channel pattern.

Gold cheers US-Iran geopolitical escalation

Gold is finding renewed bids in Asian trades on Tuesday, making another attempt to regain the $5,400 level amid persistent demand for safe-haven assets as the Iran war extends. A softer risk tone remains in play as US President Donald Trump continues to threaten deeper escalation to the ongoing war with Iran, warning that a “big wave” is yet to come.

Top Crypto Gainers: Near Protocol, Virtuals Protocol, and Morpho lead market recovery

Near Protocol, Virtuals Protocol, and Morpho are leading the market recovery with double-digit gains over the last 24 hours. Technically, NEAR extends the breakout of the falling channel pattern, VIRTUAL holds above the 50-day EMA, while MORPHO tests a crucial resistance. 

The market is not panicking it is repricing the probability distribution of Oil and time

At the end of the day, markets do not trade morality or geopolitics. They trade transmission channels. And the only channel that truly matters in this maelstrom runs through the price of energy and the time value of money.

Grass 20% bullish breakout defies broader market weakness

Grass (GRASS) is edging up above $0.30 at the time of writing on Monday. The token’s notable 20% intraday surge stands out amid heightened volatility in the broader crypto market.