|

EUR/JPY Price Analysis: Faces robust resistance around 140.00 and collapses below 139.00

  • EUR/JPY finishes negative in the week, down by 0.48% as the yen shows signs of strength.
  • Deteriorated market mood, augmented appetite for safe-haven peers.
  • EUR/JPY Price Analysis: In the near term is downward biased, eyeing a fall below 137.00.

The EUR/JPY plummets from weekly highs hit on Thursday at 142.32, drops more than 160 pips on Friday, towards the 138.00 area, amidst a dampened market mood, which increased safety appetite, bolstering in the FX space, the Japanese yen. At the time of writing, the EUR/JPY is trading at 138.93.

US equities fell between 0.43% and 1.77% as Wall Street closed. Social media companies missing earnings estimations, alongside soft US economic data, added to recession fears. In the FX space, the greenback finished flat on Friday, as shown by the US Dollar Index, but slid 1.28%, snapping three consecutive weeks of gains.

Also read: EUR/JPY Price Analysis: Plunges 200 pips after hitting a two-week high

EUR/JPY Price Analysis: Technical outlook

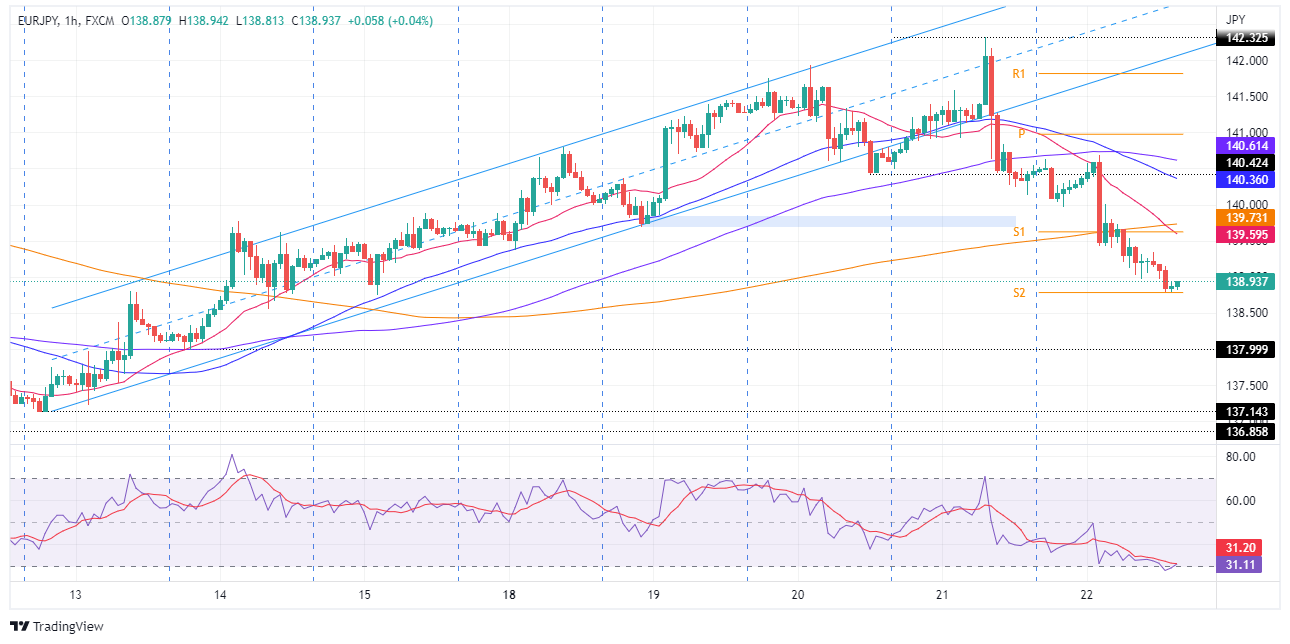
The EUR/JPY Is still upward biased, despite the ongoing pullback from weekly highs at 142.32, towards its lows at 138.89. Traders should note that the cross-currency slumped below the 20 and 50-day EMA, exacerbating the break below 139.00. However, unless EUR/JPY sellers reclaim the 100-day EMA at 137.06, the uptrend is intact.

EUR/JPY 1-hour chart

The EUR/JPY hourly chart illustrates that once the pair dived below the ascending channel bottom trendline alongside the 140.42 July 20 low, the bias would shift neutral-to-downwards in the near term. However, sellers outweighing buyers by large sent the cross plunging from the 140.00 area to 138.90s, breaking beneath the 200-hour EMA on its way down.

Therefore, the EUR/JPY in the near term is downward biased. The EUR/JPY first support will be 138.50. Break below will expose the July 13 low at 137.99, followed by the July 12 swing low at 137.14.
EUR/JPY Key Technical Levels


Overview
Today last price138.93
Today Daily Change-1.61
Today Daily Change %-1.15
Today daily open140.53
 
Trends
Daily SMA20140.3
Daily SMA50139.54
Daily SMA100136.97
Daily SMA200133.53
 
Levels
Previous Daily High142.32
Previous Daily Low140.14
Previous Weekly High139.89
Previous Weekly Low137.02
Previous Monthly High144.28
Previous Monthly Low137.93
Daily Fibonacci 38.2%140.97
Daily Fibonacci 61.8%141.49
Daily Pivot Point S1139.67
Daily Pivot Point S2138.81
Daily Pivot Point S3137.48
Daily Pivot Point R1141.86
Daily Pivot Point R2143.18
Daily Pivot Point R3144.04

Author

Christian Borjon Valencia

Markets analyst, news editor, and trading instructor with over 14 years of experience across FX, commodities, US equity indices, and global macro markets.


More from Christian Borjon Valencia
Share:

Editor's Picks

GBP/USD hovers around daily lows near 1.3450

GBP/USD trades with decent losses on Thursday, revisiting the 1.3450 zone. Cable’s resumption of the selling interest comes after two daily advances in a row and follows the improved sentiment around the Greenback amid fresh concerns in the Middle East.

EUR/USD slips back to two-day lows near 1.1510

EUR/USD faces some renewed downside pressure and retests the low 1.1500s in the latter part of Thursday’s NA session. The move lower in spot comes after two daily advances in a row and follows the fresh bid bias in the US Dollar amid the re-emergence of some effervescence in the Middle East. Moving forward, US NFP data will take centre stage on Friday.

How Wall Street rigs the game [Video]

In this week’s Live from the Vault, Andrew Maguire is joined by Peter Antico and Sean Stone to discuss the Paradigm of Money - an in-depth expose of financial market corruption, from naked shorting to the two-tier system that protects Wall Street.

Dogecoin Price Forecast: DOGE sell-off seems unstoppable despite renewed retail interest
Dogecoin (DOGE) is trading under dominant selling pressure on Thursday, hovering below $0.0700, a recent support-turned-resistance level. The meme coin has shed 3% of its value in the first week of August, against a backdrop of heavier selling pressure in previous months since May highs around $0.1186.
The Fed is doing the exact opposite of what it should be doing
About the Yen: The WSJ has a front-page story about how the Fed is doing the exact opposite of what it should be doing—lending dollars to Japan to buy yen. “Put simply: America is printing dollars so Japan can buy yen.
9-3: Is the Federal Reserve’s vote tally Warsh's new forward guidance?
The rate did not move. Neither did the statement, and that’s the more interesting fact. Set the July 29 Federal Open Market Committee (FOMC) statement beside the one issued on June 17, and the two documents are identical apart from a single verb and a paragraph at the bottom naming three dissenters.















