|

EUR/JPY Price Analysis: Plunges 200 pips after hitting a two-week high

  • EUR/JPY is set to finish the week with decent gains of 0.58%.
  • The EUR/JPY seesawed on a 200 pip range due to ECB’s decision on Thursday.
  • EUR/JPY Price Analysis: The hourly chart is neutral-downward biased and might print a leg up towards 141.00 before resuming downwards.

The EUR/JPY edges up as the Asian session begins, though it is trading near Thursday’s lows, printed on a volatile trading session, where the European Central Bank (ECB) hiked rates by 50 bps. After the ECB's decision, the EUR/JPY hit a fresh two-week high at 142.32 but nosedived to the daily low at 140.13 once investors dissected the monetary policy statement, alongside the ECB’s President Mrs. Lagarde’s presser. At the time of writing, the EUR/JPY is trading at 140.41.

Also read: EUR/JPY Price Analysis: Struggles around 142.00, tanks below 140.50

EUR/JPY Price Analysis: Technical outlook

The EUR/JPY daily chart depicts the pair as neutral biased, even though the daily EMAs reside below the spot price. EUR/JPY traders should note that buyers have been unable to challenge the YTD high around 144.27, signaling sellers that it was the time to step in. The latter ones piled around the GBP/JPY weekly high around 142.32 and sent the pair towards the 20-day EMA at 140.17, but they will need a daily close below to increase their chances of testing the 50-day EMA at 139.61.

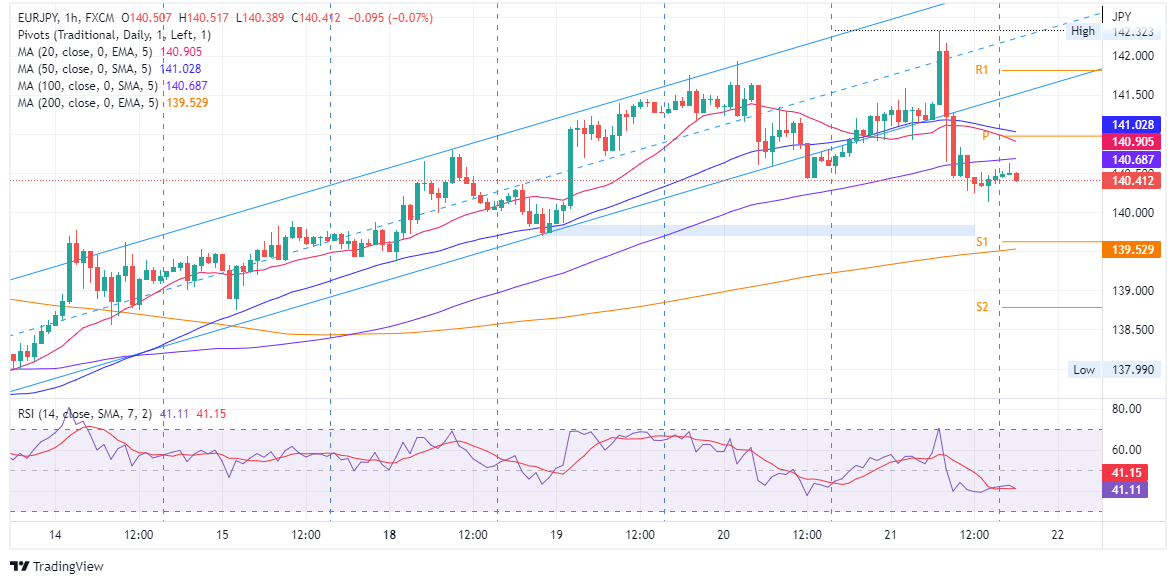
EUR/JPY 1-hour chart

The EUR/JPY hourly chart is neutral-to-downward biased. Although the hourly EMAs are above the exchange rate, except for the 200-hour, the Relative Strenght Index (RSI) shifted above the RSI’s 7-period SMA, used them in conjunction as buying/selling signals, suggesting that a leg-up is on the cards. Therefore, the GBP/JPY might aim to the confluence of the 20 and 50-hour EMAs, where the daily pivot resides around the 140.95-141.05 area, before resuming downwards.

That said, the GBP/JPY’s first support will be the July 21 daily low at 140.13. A breach of the latter will expose the confluence of the 200-hour EMA and the S1 daily pivot around the 139.53-63 range, followed by a challenge to the S2 daily pivot at 138.80.

EUR/JPY Key Technical Levels

EUR/JPY

Overview
Today last price140.41
Today Daily Change-0.14
Today Daily Change %-0.10
Today daily open140.65
 
Trends
Daily SMA20140.37
Daily SMA50139.4
Daily SMA100136.84
Daily SMA200133.49
 
Levels
Previous Daily High141.93
Previous Daily Low140.43
Previous Weekly High139.89
Previous Weekly Low137.02
Previous Monthly High144.28
Previous Monthly Low137.93
Daily Fibonacci 38.2%141
Daily Fibonacci 61.8%141.36
Daily Pivot Point S1140.08
Daily Pivot Point S2139.5
Daily Pivot Point S3138.57
Daily Pivot Point R1141.58
Daily Pivot Point R2142.51
Daily Pivot Point R3143.09

Author

Christian Borjon Valencia

Christian Borjon began his career as a retail trader in 2010, mainly focused on technical analysis and strategies around it. He started as a swing trader, as he used to work in another industry unrelated to the financial markets.

More from Christian Borjon Valencia
Share:

Markets move fast. We move first.

Orange Juice Newsletter brings you expert driven insights - not headlines. Every day on your inbox.

By subscribing you agree to our Terms and conditions.

Editor's Picks

EUR/USD tests 1.1800, closes in on a fresh two-month high

EUR/USD extends its gains for the second consecutive day on Tuesday and trades near 1.1800. The broad-based US Dollar weakness and a potential policy divergence between the European Central Bank and the Federal Reserve keep the bullish bias intact heading into the holiday season.

GBP/USD climbs above 1.3500 area, renews 11-week peak

GBP/USD extends its weekly rally and trades at its highest level since early October above 1.3500. The US Dollar remains under persistent bearish pressure heading into the Christmas break, while Pound traders largely brush off the latest interest rate cut from the Bank of England.

Gold approaches $4,500 as record-setting rally continues

Gold builds on Monday's impressive gains and advances toward $4,500, setting fresh record-highs along the way. Heightened geopolitical tensions, combined with the ongoing US Dollar (USD) selloff ahead of the Q3 GDP data, help XAU/USD preserve its bullish momentum.

US GDP expected to highlight steady growth in Q3

The United States Bureau of Economic Analysis (BEA) will publish the first preliminary estimate of the third-quarter Gross Domestic Product on Tuesday, at 13:30 GMT. Analysts expect the data to show annualized growth of 3.2%, following the 3.8% expansion in the previous quarter.

Ten questions that matter going into 2026

2026 may be less about a neat “base case” and more about a regime shift—the market can reprice what matters most (growth, inflation, fiscal, geopolitics, concentration). The biggest trap is false comfort: the same trades can look defensive… right up until they become crowded.

XRP steadies above $1.90 support as fund inflows and retail demand rise

Ripple (XRP) is stable above support at $1.90 at the time of writing on Monday, after several attempts to break above the $2.00 hurdle failed to materialize last week. Meanwhile, institutional interest in the cross-border remittance token has remained steady.