|

EUR/GBP Price Analysis: Inverse H&S highlights 0.8660 resistance

  • EUR/GBP teases confirmation of a bullish chart pattern, reverses the previous day’s losses.
  • 200-SMA adds to the upside filters, 0.8570 restricts short-term downside.
  • RSI, MACD suggests further upside momentum toward the monthly high.

EUR/GBP picks up bids to reverse the previous day’s losses around 0.8650 during the initial European session on Wednesday.

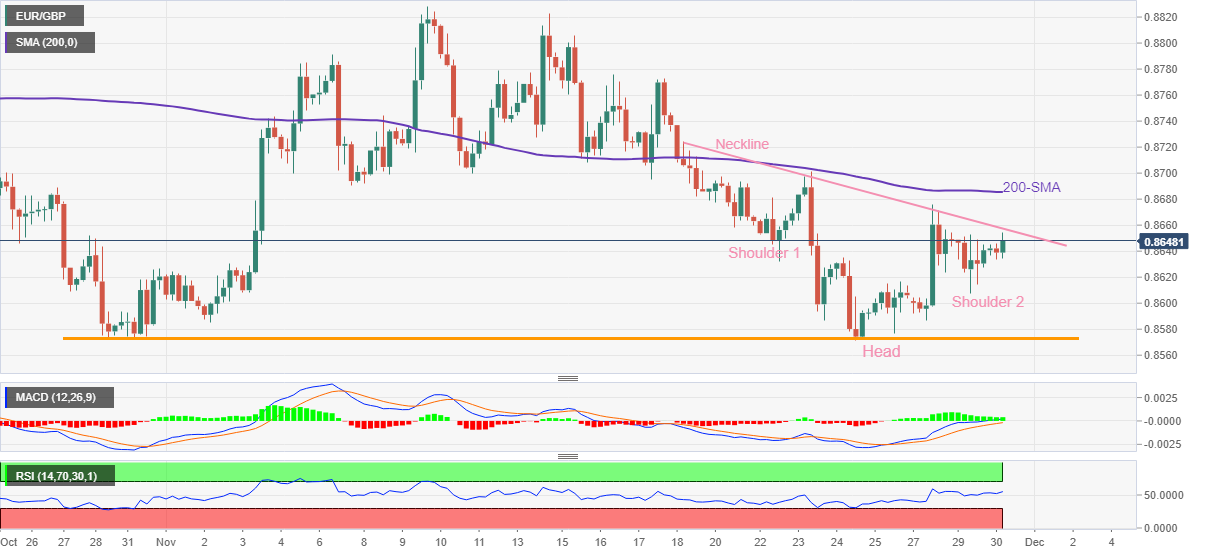
In doing so, the cross-currency pair extends Friday’s rebound from the lowest levels since September while poking the neckline of a short-term inverse head-and-shoulders (H&S) bullish chart formation.

It’s worth observing that the upward-sloping RSI (14), not overbought, joins the bullish MACD signals to suggest a clear break of the 0.8660 hurdle.

Following that, the 200-SMA level of 0.8685 could probe the advances toward the theoretical target surrounding the monthly high near 0.8830.

On the contrary, pullback moves remain elusive unless staying beyond the latest swing low of 0.8607.

Even so, the lows marked during late October and in the last week, around 0.8570, appear a tough nut to crack for the EUR/GBP bears.

In a case where the pair remains weak past 0.8570, September’s bottom near 0.8565 may act as a buffer as sellers aim for the August 19 peak of 0.8511.

Overall, EUR/GBP is likely to remain firmer and can extend the latest recovery as the inverse H&S formation joins upbeat oscillators, namely the RSI and MACD.

EUR/GBP: Four-hour chart

Trend: Further upside expected

Additional important levels

Overview
Today last price0.8647
Today Daily Change0.0004
Today Daily Change %0.05%
Today daily open0.8643
 
Trends
Daily SMA200.8696
Daily SMA500.8724
Daily SMA1000.8622
Daily SMA2000.8537
 
Levels
Previous Daily High0.8652
Previous Daily Low0.8607
Previous Weekly High0.8701
Previous Weekly Low0.8572
Previous Monthly High0.8867
Previous Monthly Low0.8572
Daily Fibonacci 38.2%0.8625
Daily Fibonacci 61.8%0.8635
Daily Pivot Point S10.8616
Daily Pivot Point S20.8589
Daily Pivot Point S30.8571
Daily Pivot Point R10.8661
Daily Pivot Point R20.868
Daily Pivot Point R30.8707

Author

Anil Panchal

Anil Panchal

FXStreet

Anil Panchal has nearly 15 years of experience in tracking financial markets. With a keen interest in macroeconomics, Anil aptly tracks global news/updates and stays well-informed about the global financial moves and their implications.

More from Anil Panchal
Share:

Editor's Picks

EUR/USD seems fragile below 1.1700 as Middle East war boosts energy prices

The EUR/USD pair trades flat at around 1.1680 during the Asian trading session on Tuesday, but broadly seems vulnerable, being close to its five-week low. The major currency pair is under pressure as surging oil prices due to the United States-Israel war with Iran have increased the risks of higher inflation for the Old Continent.

GBP/USD hovers around 1.3400 with bearish pressure intact

GBP/USD edges higher after three days of losses, trading around 1.3400 during the Asian hours on Tuesday. The technical analysis of the daily chart indicates an ongoing bearish bias, as the pair trades within a descending channel pattern.

Gold stays bullish as Iran war continues to spur safe-haven flows

Gold is finding renewed bids in Asian trades on Tuesday, making another attempt to regain the $5,400 level amid persistent demand for safe-haven assets as the Iran war extends. A softer risk tone remains in play as US President Donald Trump continues to threaten deeper escalation to the ongoing war with Iran, warning that a “big wave” is yet to come.

Top Crypto Gainers: Near Protocol, Virtuals Protocol, and Morpho lead market recovery

Near Protocol, Virtuals Protocol, and Morpho are leading the market recovery with double-digit gains over the last 24 hours. Technically, NEAR extends the breakout of the falling channel pattern, VIRTUAL holds above the 50-day EMA, while MORPHO tests a crucial resistance. 

The market is not panicking it is repricing the probability distribution of Oil and time

At the end of the day, markets do not trade morality or geopolitics. They trade transmission channels. And the only channel that truly matters in this maelstrom runs through the price of energy and the time value of money.

Grass 20% bullish breakout defies broader market weakness

Grass (GRASS) is edging up above $0.30 at the time of writing on Monday. The token’s notable 20% intraday surge stands out amid heightened volatility in the broader crypto market.