|

EUR/GBP Price Analysis: Falls to near 0.8550 amid uncertainty over timing of ECB, BoE rate cuts

  • EUR/GBP slips to 0.8550 as hot Eurozone inflation data deepen uncertainty over ECB’s timing of rate cuts.
  • The highest inflation in the UK economy among G-7 economies indicates that the BoE will cut interest rates later than the ECB.
  • The EUR/GBP is near a make-or-a-break point.

The EUR/GBP pair drops slightly to 0.8550 in the European session on Monday as investors remain uncertain when the European Central Bank (ECB) and the Bank of England (BoE) will begin cutting interest rates.

The Eurozone’s preliminary inflation data for February, released on Friday, showed that annual core inflation data, which excludes volatile items such as food and oil prices, grew at a higher pace of 3.1% against expectations of 2.9% but the pace was lower than January’s reading of 3.3%. The monthly core inflation data rose 0.7% after deflating 0.9% in January. This has deepened uncertainty over the timing of rate cuts by the ECB.

Meanwhile, higher inflation in the United Kingdom economy indicates that the BoE will cut interest rates later than the ECB. The UK’s inflation is highest in the Group of Seven economies (G-7), forcing BoE policymakers to hold interest rates in the restrictive territory for a longer period.

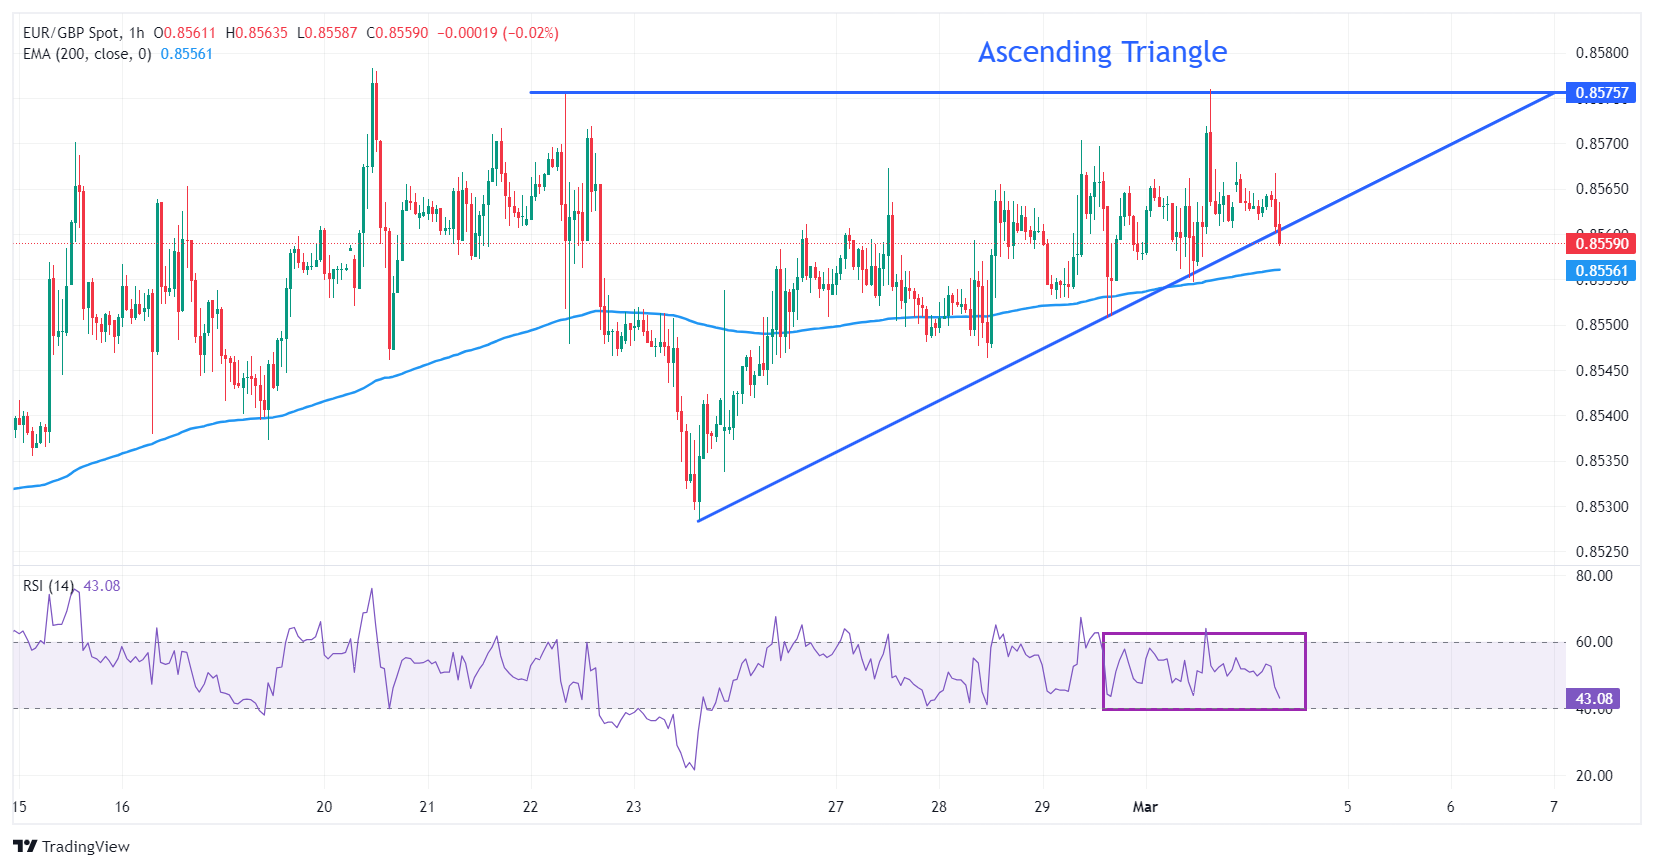
EUR/GBP hovers near the upward-sloping border of the Ascending Triangle pattern formed on an hourly timeframe, plotted from February 23 low at 0.8529. The horizontal resistance of the aforementioned chart pattern is placed from February 22 high at 0.8576.

An Ascending Triangle pattern exhibits indecisiveness among market participants but with a slight upside bias due to higher lows and flat highs.

The 14-period Relative Strength Index (RSI) oscillates in the 40.00-60.00 range, indicating a sharp volatility contraction.

Fresh upside would appear if the asset breaks above February 22 high at 0.8576, driving the asset towards the round-level resistance of 0.8600, followed by January 16 high near 0.8620.

On the contrary, the appeal for the asset weakens if it drops below February 19 low at 0.8537. This would drag the asset towards February 7 low at 0.8516 and the psychological support of 0.8500.

EUR/GBP hourly chart

EUR/GBP

Overview
Today last price0.8559
Today Daily Change-0.0004
Today Daily Change %-0.05
Today daily open0.8563
 
Trends
Daily SMA200.8548
Daily SMA500.8577
Daily SMA1000.8624
Daily SMA2000.8611
 
Levels
Previous Daily High0.8576
Previous Daily Low0.8555
Previous Weekly High0.8576
Previous Weekly Low0.8534
Previous Monthly High0.8578
Previous Monthly Low0.8498
Daily Fibonacci 38.2%0.8568
Daily Fibonacci 61.8%0.8563
Daily Pivot Point S10.8553
Daily Pivot Point S20.8543
Daily Pivot Point S30.8532
Daily Pivot Point R10.8574
Daily Pivot Point R20.8586
Daily Pivot Point R30.8596

Author

Sagar Dua

Sagar Dua

FXStreet

Sagar Dua is associated with the financial markets from his college days. Along with pursuing post-graduation in Commerce in 2014, he started his markets training with chart analysis.

More from Sagar Dua
Share:

Editor's Picks

AUD/USD eyes 0.7150 barrier nine-day EMA

AUD/USD inches higher after registering modest losses in the previous day, trading around 0.7130 during the Asian hours. The technical analysis of the daily chart indicates that the pair is moving sideways within the rectangle pattern, suggesting a consolidation as neither the bulls nor the bears have enough momentum to take control of the market.

USD/JPY trades below 160.00 intervention threshold; bullish bias intact

The USD/JPY pair attracts some sellers during the Asian session amid fears that authorities will step in again to prop up the Japanese Yen. Furthermore, the Israel-Lebanon truce prompts some profit-taking around the US Dollar and exerts downward pressure on the currency pair.

Gold defends 200-day SMA, rises toward $4,500

Gold is attempting a tepid recovery toward $4,500 on Thursday, as renewed optimism in the Mideast geopolitical front calms market nerves. This cautious optimism across Asian markets weighs on Oil prices, and diminishes the US Dollar’s safe-haven appeal, helping Gold stage a decent comeback from the weekly low of $4,424.


Hyperliquid: ETF demand, capital rotation fuel HYPE rally as Bitcoin melts

Hyperliquid price sustains an upward trend near its all-time high of $75.76 on Thursday after posting 80% gains in May, while Bitcoin (BTC) retraces below $65,000, triggering a market-wide panic.

Kevin Warsh takes the Fed helm: What it means for the US Dollar
The Federal Reserve moves away from the highly predictable "forward guidance" model of the Jerome Powell era to a new “Kevin Warsh environment”, characterized by less communication, more policy surprises, and an increased focus on the Fed's complex balance sheet.
Recession on paper: What really moves the Canadian Loonie now?

Statistics Canada handed the headline writers a gift and the analysts a headache. Real GDP shrank 0.1% on an annualized basis in the first quarter, and with the fourth quarter of 2025 revised down to a 1.0% contraction, that is two negative quarters in a row, the textbook definition of a technical recession and Canada's first since the pandemic.