Dow Jones Industrial Average regains upside traction on risk-on mood

- Dow Jones index is posting moderate gains after having opened with losses on Thursday.
- US PPI data has provided some relief to investors although market sentiment remains frail.
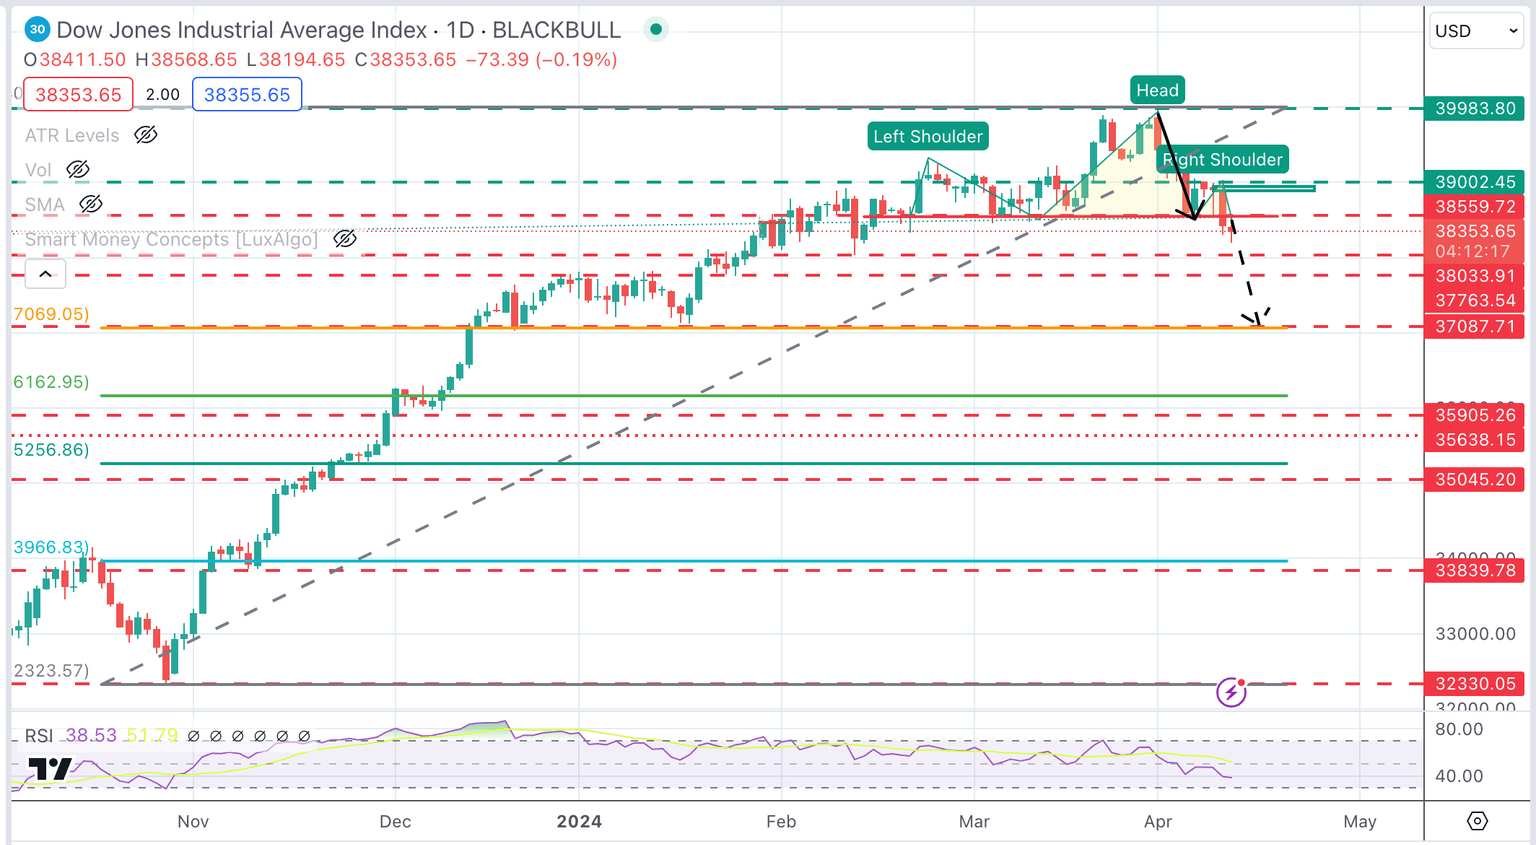
- The Dow Jones index forms a bearish Head & Shoulders pattern that might anticipate deeper correction.
The Dow Jones Industrial Average (DJIA) is showing marginal gains following a negative opening on Thursday. A mixed US PPI reading and soothing comments by Fed speakers have eased the risk-averse sentiment triggered by Wednesday’s Consumer Price Index (CPI).
US Producer Prices Index (PPI) rose at a 0.2% MoM rate in March, below the 0.6% increase seen in the previous month. The yearly rate accelerated to 2.1% from 1.6% in February, which was still below the 2.2% rate forecasted by market experts. Somewhat later while Fed's Williams and Collins have shown confidence that inflation will moderate and that the bank will have to ease its restrictive monetary policy.
Wall Street indices are advancing gradually as we head into Thursday's closing times. The NASDAQ 1.71% higher at 16,445, the S&P 500 trading 0.96% above the opening level at 5,209, and the Dow Jones adds 0.3% to 38,584.
Dow Jones news
Most Wall Street sectors swung to positive levels on Thursday's afternoon trading . Technology is leading gains with a 2.3% advance, followed by Communication Services, up 1.3%. On the losing end, only the Energy sector with a 0.35% decline, followed by Financials, which is 0.1% lower.
Apple (AAPL) is leading the winners with a 3.8% rally to $174.27, followed by Nike (NKE) 3.7% up to $92.33, boosted by the release of the US Olympic uniforms. Travelers Companies (TRV) is the worst performer of the index with a 1.31% fall to $221.26. Next is United Health Group (UNH), down 1.1% to $445.11.
Dow Jones technical outlook
The Dow Jones Index is trading lower again on Thursday. The move below 38,560 has activated a bearish Head & Shoulders pattern that might anticipate a sharper decline.
The next bearish targets are 38,033 and 37,750. The measured target of the H&S pattern is the mid-January low and 38.6% Fibonacci retracement at 37,087. A bullish reaction above 38,540 might find some more supply ahead of 39,000 (order block).
Dow Jones Index Daily Chart
Dow Jones FAQs
The Dow Jones Industrial Average, one of the oldest stock market indices in the world, is compiled of the 30 most traded stocks in the US. The index is price-weighted rather than weighted by capitalization. It is calculated by summing the prices of the constituent stocks and dividing them by a factor, currently 0.152. The index was founded by Charles Dow, who also founded the Wall Street Journal. In later years it has been criticized for not being broadly representative enough because it only tracks 30 conglomerates, unlike broader indices such as the S&P 500.
Many different factors drive the Dow Jones Industrial Average (DJIA). The aggregate performance of the component companies revealed in quarterly company earnings reports is the main one. US and global macroeconomic data also contributes as it impacts on investor sentiment. The level of interest rates, set by the Federal Reserve (Fed), also influences the DJIA as it affects the cost of credit, on which many corporations are heavily reliant. Therefore, inflation can be a major driver as well as other metrics which impact the Fed decisions.
Dow Theory is a method for identifying the primary trend of the stock market developed by Charles Dow. A key step is to compare the direction of the Dow Jones Industrial Average (DJIA) and the Dow Jones Transportation Average (DJTA) and only follow trends where both are moving in the same direction. Volume is a confirmatory criteria. The theory uses elements of peak and trough analysis. Dow’s theory posits three trend phases: accumulation, when smart money starts buying or selling; public participation, when the wider public joins in; and distribution, when the smart money exits.
There are a number of ways to trade the DJIA. One is to use ETFs which allow investors to trade the DJIA as a single security, rather than having to buy shares in all 30 constituent companies. A leading example is the SPDR Dow Jones Industrial Average ETF (DIA). DJIA futures contracts enable traders to speculate on the future value of the index and Options provide the right, but not the obligation, to buy or sell the index at a predetermined price in the future. Mutual funds enable investors to buy a share of a diversified portfolio of DJIA stocks thus providing exposure to the overall index.
Author

Guillermo Alcala
FXStreet
Graduated in Communication Sciences at the Universidad del Pais Vasco and Universiteit van Amsterdam, Guillermo has been working as financial news editor and copywriter in diverse Forex-related firms, like FXStreet and Kantox.


