Dow Jones Industrial Average struggled to recover ground after going flat on Friday
- Dow Jones looking for balance after getting clobbered this week.
- Investors looking for a foothold after a harsh rebalance of rate cut expectations.
- US Durable Goods Orders, UoM Consumer Sentiment recovered on Friday.

The Dow Jones Industrial Average (DJIA) moderated on Friday, treading water after seeing its second-worst trading day of 2024 on Thursday. The equity index ended flat on the day trading week’s close, with investor sentiment broadly recovering.
Read more: US Durable Goods Orders rise 0.7% in April vs. -0.8% expected
US Durable Goods Orders in April rose 0.7% MoM, shrugging off the forecast -0.8% decline, while the previous month’s print was revised to 0.8% from 2.6%. The University of Michigan’s Consumer Sentiment Index for May climbed to 69.1 versus the forecast uptick to 67.5 from the previous 67.4. UoM 5-year Consumer Inflation Expectations also eased to 3.0% from the expected hold at 3.1%, putting further upside pressure on market sentiment as investors look for any sign that inflation figures could ease moving forward.
Forecasting the Coming Week: Fedspeak and PCE remain in the spotlight
Broad-market expectations of Federal Reserve (Fed) rate cuts were knocked back once again this week, and according to the CME’s FedWatch Tool, rate traders are pricing in slightly worse than even odds of at least a quarter-point rate cut from the Fed in September. This is sharply lower than the 70% odds of at least 25 basis points that was priced in at the beginning of the week.
Dow Jones news
A meager Friday recovery leaves the DJIA the worst-performing of the major US equity indexes, ending Friday close to where it started. Around a third of the Dow Jones’ constituent securities were down on Friday, with losses being led by Salesforce Inc. (CRM). CRM fell -2.2% on the day, declining to $272.29 per share.
On the high side, Intel Corp. (INTC) was the Dow Jones’ top gainer, climbing 2.13% to $30.72 per share. INTC was closely followed by JPMorgan Chase & Co. (JPM), which rose 1.92% on Friday to $200.71 per share.
Dow Jones technical outlook
The Dow Jones finds thin gains on Friday as the major equity index struggles to recover from recent bearish momentum. The Dow Jones is grappling with the 39,000.00 handle after tumbling from record all-time highs set last week above 40,000.00. An intraday technical floor is priced in at 39,020.00, but the index is steeply off highs, down -2.55% top-to-bottom from last Friday’s record peak.
Downside momentum is running into technical support from the 50-day Exponential Moving Average (EMA) at 38,908.78. Despite near-term losses, the Dow Jones remains firmly bullish, trading deep into bull country and up 3.7% in 2024.
Dow Jones five minute chart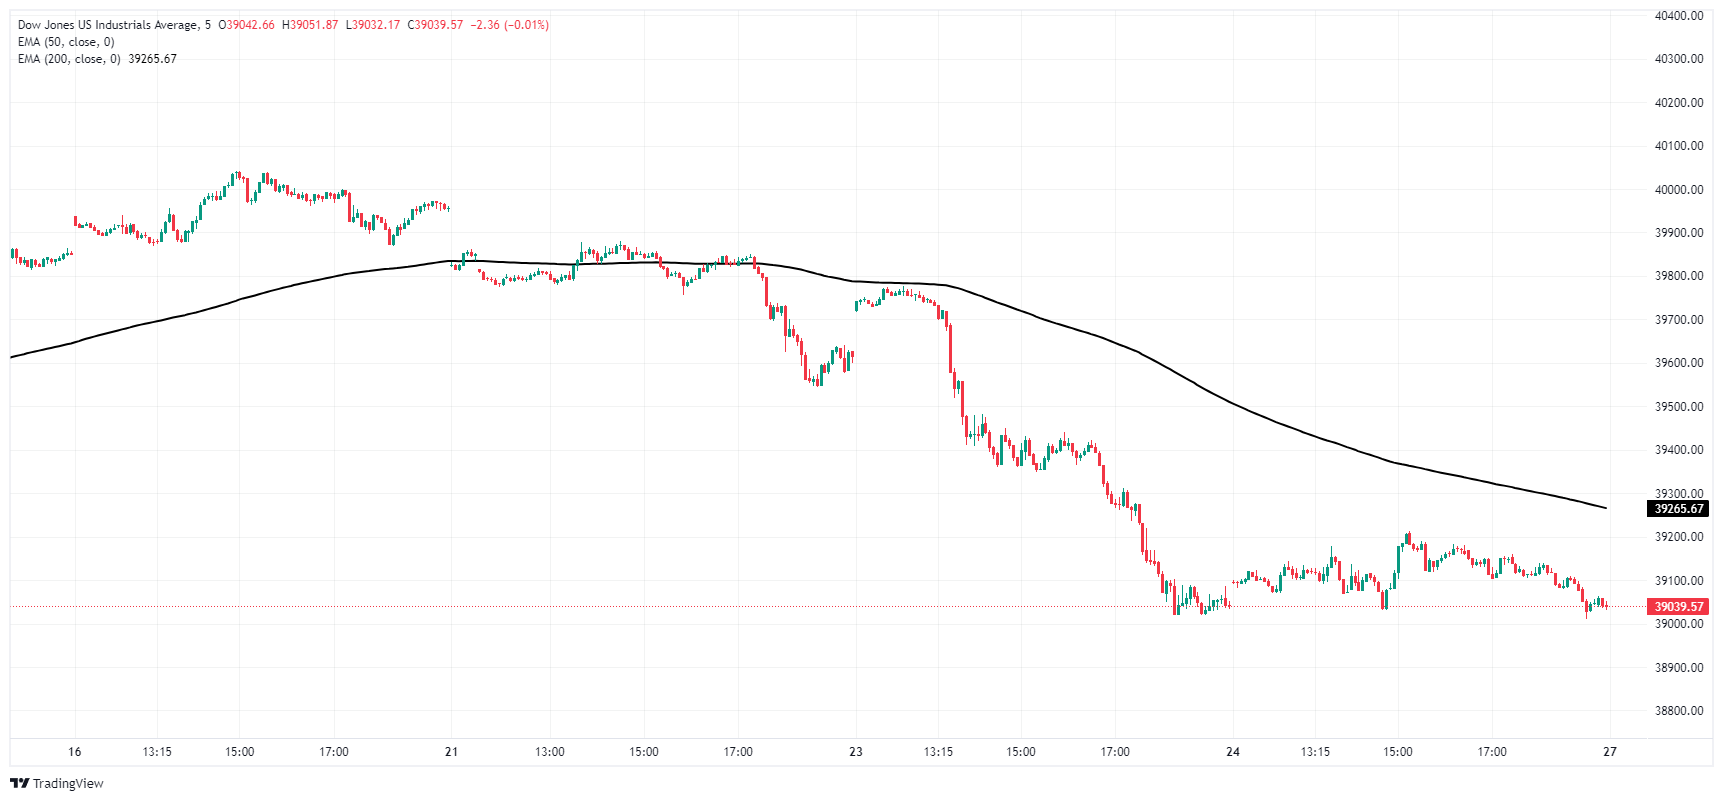
Dow Jones daily chart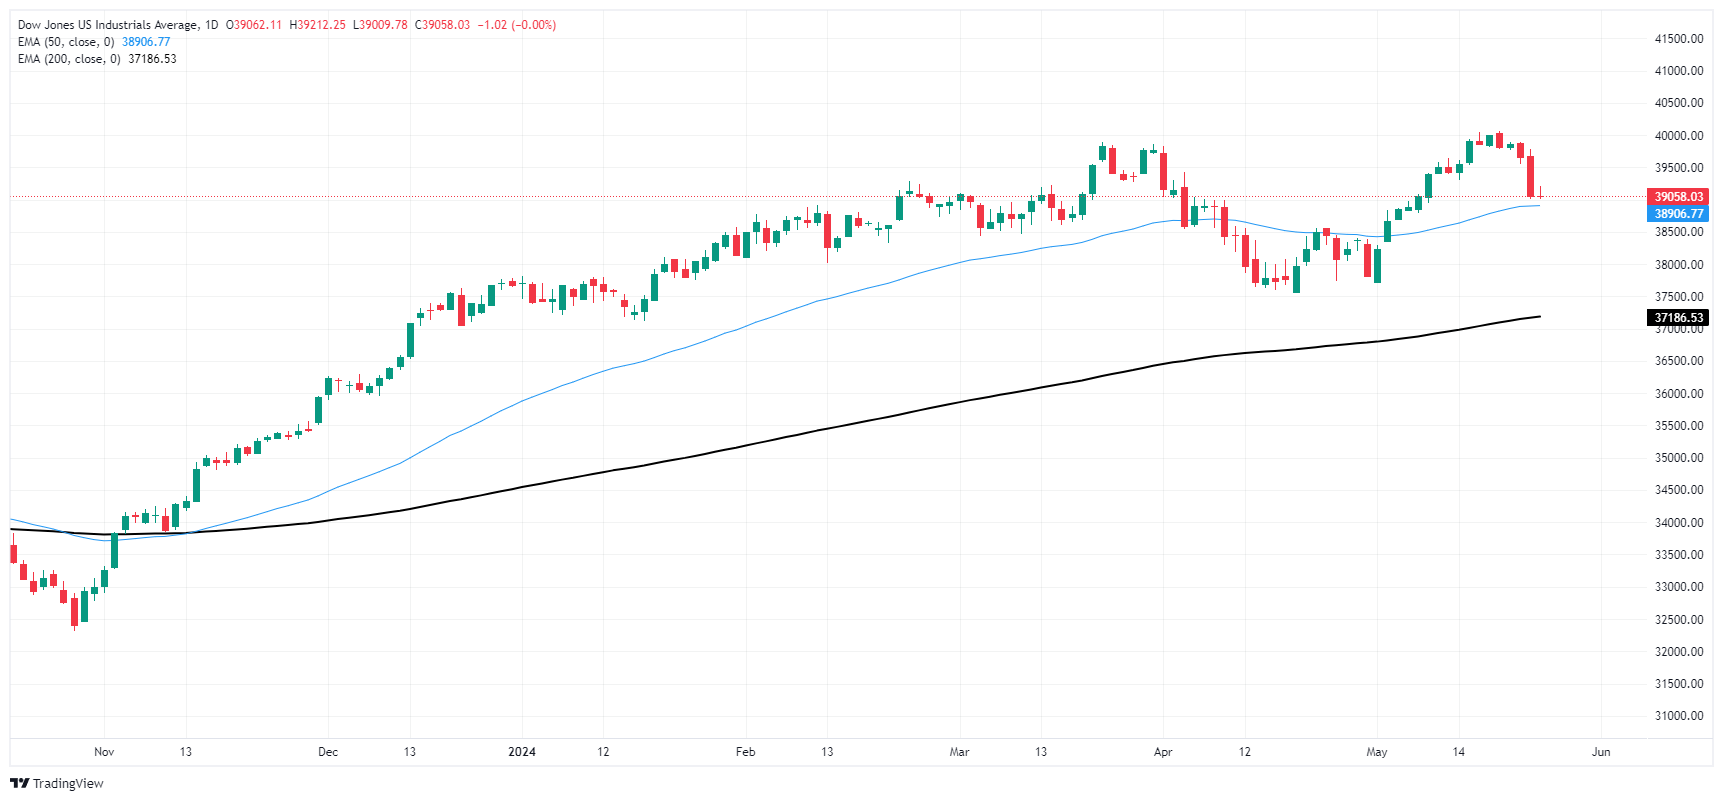
Dow Jones FAQs
The Dow Jones Industrial Average, one of the oldest stock market indices in the world, is compiled of the 30 most traded stocks in the US. The index is price-weighted rather than weighted by capitalization. It is calculated by summing the prices of the constituent stocks and dividing them by a factor, currently 0.152. The index was founded by Charles Dow, who also founded the Wall Street Journal. In later years it has been criticized for not being broadly representative enough because it only tracks 30 conglomerates, unlike broader indices such as the S&P 500.
Many different factors drive the Dow Jones Industrial Average (DJIA). The aggregate performance of the component companies revealed in quarterly company earnings reports is the main one. US and global macroeconomic data also contributes as it impacts on investor sentiment. The level of interest rates, set by the Federal Reserve (Fed), also influences the DJIA as it affects the cost of credit, on which many corporations are heavily reliant. Therefore, inflation can be a major driver as well as other metrics which impact the Fed decisions.
Dow Theory is a method for identifying the primary trend of the stock market developed by Charles Dow. A key step is to compare the direction of the Dow Jones Industrial Average (DJIA) and the Dow Jones Transportation Average (DJTA) and only follow trends where both are moving in the same direction. Volume is a confirmatory criteria. The theory uses elements of peak and trough analysis. Dow’s theory posits three trend phases: accumulation, when smart money starts buying or selling; public participation, when the wider public joins in; and distribution, when the smart money exits.
There are a number of ways to trade the DJIA. One is to use ETFs which allow investors to trade the DJIA as a single security, rather than having to buy shares in all 30 constituent companies. A leading example is the SPDR Dow Jones Industrial Average ETF (DIA). DJIA futures contracts enable traders to speculate on the future value of the index and Options provide the right, but not the obligation, to buy or sell the index at a predetermined price in the future. Mutual funds enable investors to buy a share of a diversified portfolio of DJIA stocks thus providing exposure to the overall index.
Author

Joshua Gibson
FXStreet
Joshua joins the FXStreet team as an Economics and Finance double major from Vancouver Island University with twelve years' experience as an independent trader focusing on technical analysis.


