Disney Stock Earnings News: DIS makes streaming strides against Netflix but misses expectations
- Disney stock sank after hours after missing on both top and bottom lines.
- Disney+ gained 7.9 million subscribers in fiscal Q2.
- DIS stock has lost 33% of its value year-to-date, tries to find support at $100.

The Walt Disney Company (DIS) brought a little magic to an earnings season beset by forecast misses on Wednesday. Yes, it also missed Wall Street consensus estimates for earnings and revenue in its fiscal second quarter, but the entertainment and media conglomerate impressed with a sizable gain of streaming subscribers for its Disney+ unit.
Read more stock market research
After the close the purveyor of recent hits like Encanto and Luca reported adjusted earnings per share of $1.08 compared with consensus forecasts of $1.19. Revenue was also hurt by a $1 billion charge for the termination of a license agreement, and because of it management reported revenue of $19.25 billion, nearly $800 million short of forecasts. DIS stock has shed 4.8% in Thursday's premarket to $100.15.
Disney Stock News: Disney+ subscriber base cuts distance with Netflix
Despite the forecast misses, Disney stock rose as high as 6% in Wednesday's afterhours trade before selling off. This positive sentiment was largely because its top and bottom line misses appear largely due to one-time charges. Otherwise, Disney's management appears to be executing quite well. Disney+ added 7.9 million new subscribers, which exceeded estimates for 5 million additions.
Additionally, this has brought Disney closer to the steaming king itself, Netflix. The latter expects to lose 2 million subscribers in the current quarter after losing 200,000 accounts in Q1. This would place it at 219 million subscribers worldwide. Disney+ on the other hand appears still to be in growth mode. The nearly 8 million new subscribers this quarter brings its total subscriber base to 137.7 million. When you include Hulu subscribers and ESPN+, the company's total subscriber base is already at 205 million. CEO Bob Chapek has forecast that Disney+ alone will reach 230 million to 260 million subscribers by 2024. Look out, Netflix! A legacy firm is prepared to eat your lunch.
Disney's theme parks unit has also outperformed as Covid-19 restrictions have been reduced and families become more willing to take post-pandemic vacations. The unit posted revenues of $6.7 billioin, about $400 million above expectations.
"At the Disney Media & Entertainment Distribution segment, our film and television productions have generally resumed, although we have seen disruptions of production activities depending on local circumstances," the company said in their earnings statement. "We have generally been able to release our films theatrically in the first half of fiscal 2022, although certain markets continue to impose restrictions on theater openings and capacity."
Disney Stock Forecast: $100 must hold or DIS headed to $90
Disney stock has been cut in half from its all-time high of $203 back in March 2021. In Thursday's premarket, the $100 threshold has been broken, but shares have not gone much below that and are mostly trading as low as $99.80. There are multiple past instances of $100, an important psychological figure, working as support over the past seven years. As long ago as 2015, this level has acted as support.
If $100 breaks in the regular market today, then Disney stock has further large round figures to use as support. These are namely $90 and $80. $90 worked as support in January and August of 2015 and again in October 2016. $80 was where investors caught DIS stock during the bottom of the Covid-19 panic in March 2020 and all the way back during a pullback in October of 2014.
The Relative Strength Index (RSI) reading of 24 on the weekly chart below means Disney is already pretty well oversold, but the Moving Average Convergence Divergence (MACD) has yet to cross over. Wait for that crossover to take place before jumping back into this name.
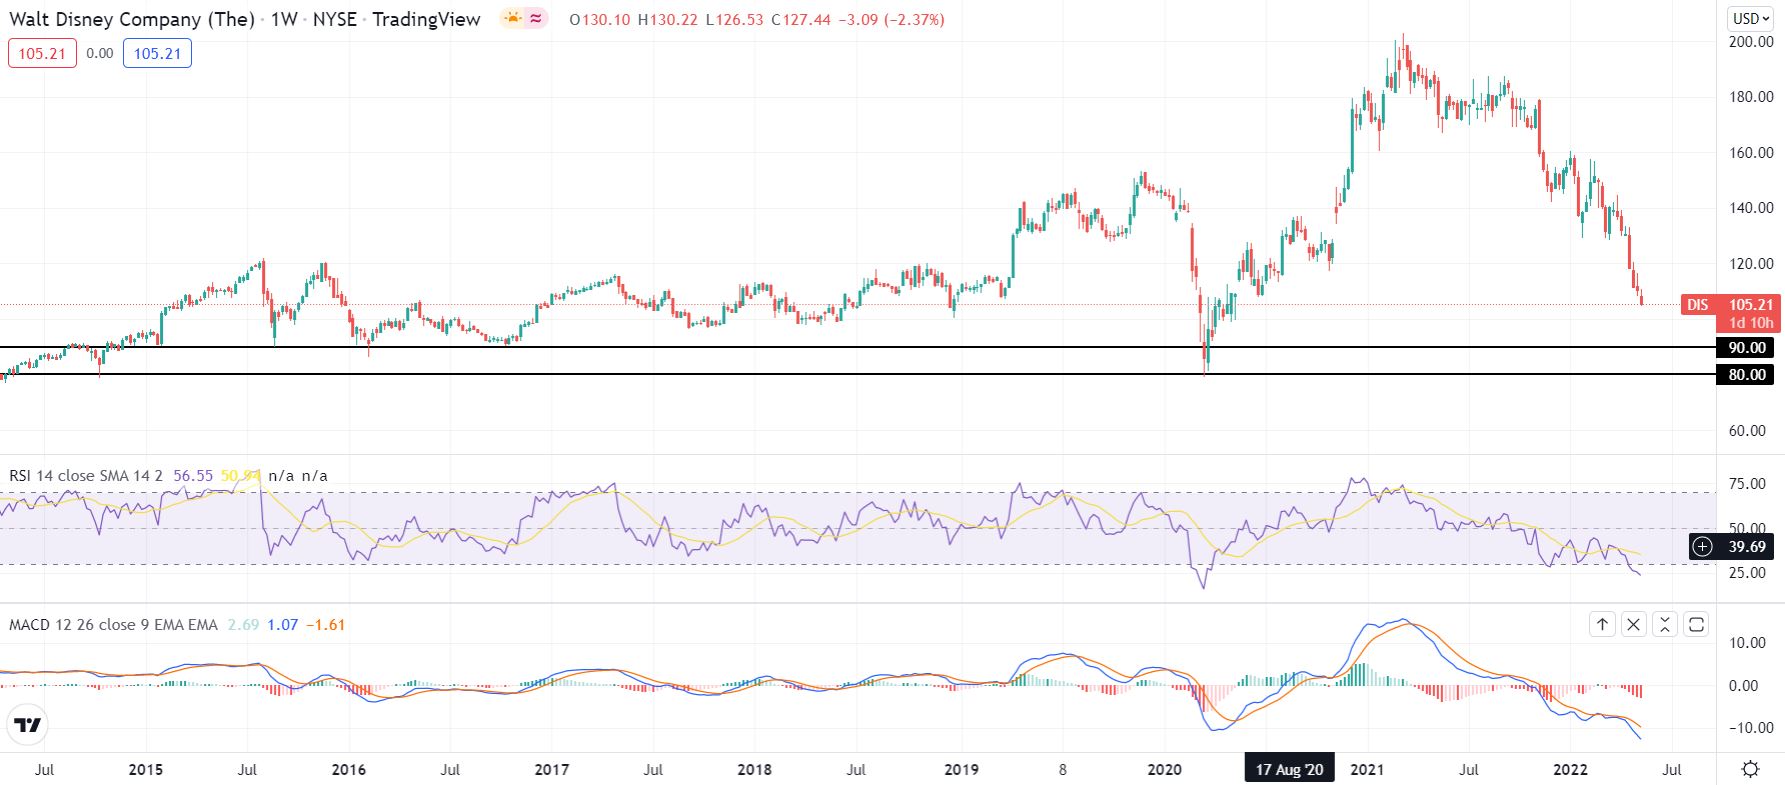
Disney stock weekly chart
Like this article? Help us with some feedback by answering this survey:
Premium
You have reached your limit of 3 free articles for this month.
Start your subscription and get access to all our original articles.
Author

Clay Webster
FXStreet
Clay Webster grew up in the US outside Buffalo, New York and Lancaster, Pennsylvania. He began investing after college following the 2008 financial crisis.


