Crude Oil continues to whip on Friday, but higher on the week as WTI inches towards $75
- Crude Oil markets pushed into a new high for the week before settling back on Friday.
- WTI roils between $74.50 and $73.00 on Friday.
- Freezing temperatures and geopolitical tensions weigh on supply concerns.

Crude Oil bids broadly rose over the week in jittery trading that saw frequent peaks and dips into highs and lows, with West Texas Intermediate (WTI) US Crude Oil settling the week near $73.60 with a 5.6% or $3 spread between the week’s late peak set late on Friday at $74.60 and Wednesday’s weekly low at $70.62.
Broad-market concerns about production caps from the Organization of the Petroleum Exporting Countries (OPEC) that plagued energy markets for much of the third quarter of 2023 have all but evaporated, being replaced by broad-market concerns that Iran-backed Houthi rebels attacking civilian ships in the Red Sea will hamper critical global supply lines between Europe and Asia.
Bullish Crude Oil prices on supply concerns have seen significant downside pressure crimp topside momentum, with the US hitting record levels of Crude Oil production in 2023 and on pace to continue ramping up barrel output looking forward.
Canada is also set to hit new production highs as Crude Oil producers in Alberta ramp up production as the Trans Mountain pipeline nears completion, which will make it easier for the oil-exporting country to add their raw light sweet crude oil supplies to the US’ logistics chain. As the fourth-largest global producer of Crude Oil, Canada stands poised to launch the US even further to the top of the leaderboard as a global net producer and exporter of downstream oil products.
Despite a historic overhang in partially-refined Crude Oil products, declines in near-term raw barrel supplies is drawing a line underneath barrel prices as energy markets await a more solidified outlook on global supply balances in Crude Oil.
WTI Technical Outlook
Choppy trading as markets get pulled in both directions leave Crude Oil traders strung along the midrange, with WTI testing familiar territory near the $74.00 handle. WTI has cycled the key price handle in a tightening pattern since descending into the neighborhood in early November, and a sideways grind in the WTI chart has the 50-day Simple Moving Average (SMA) descending into intraday territory.
The 200-day SMA is accelerating a downturn from the $78.00 handle, which will add bearish pressure to near-term price action to the low side if bulls can’t push WTI back over medium-term technical resistance at the $76.00 handle.
WTI Daily Chart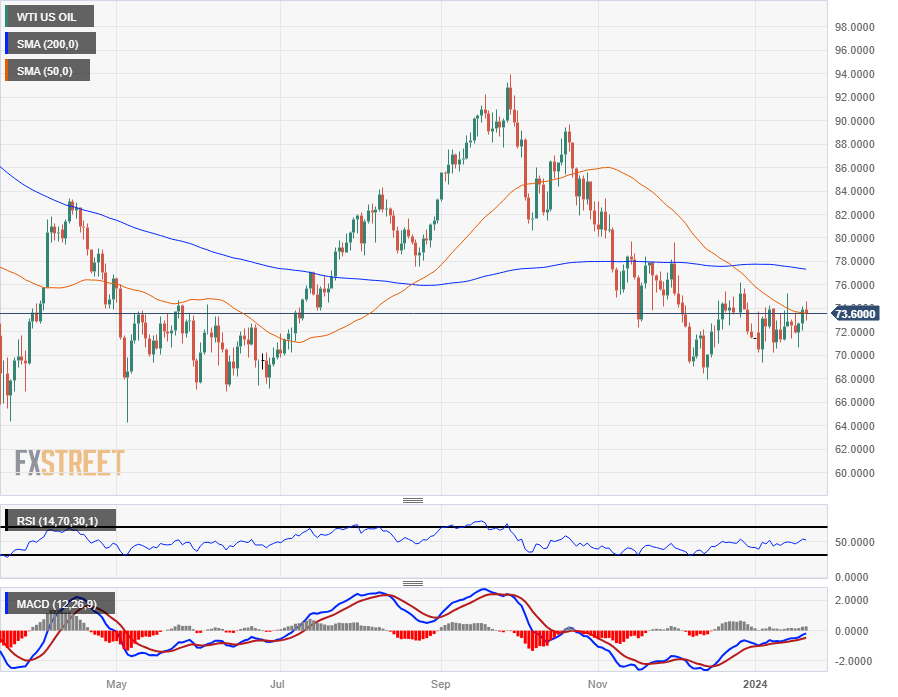
Author

Joshua Gibson
FXStreet
Joshua joins the FXStreet team as an Economics and Finance double major from Vancouver Island University with twelve years' experience as an independent trader focusing on technical analysis.


