Could Dollar General stock drop to $108?
- Dollar General has shed more than 50% of its value in 10 months.
- DG stock has been tracking lower over the past week since missing Q2 consensus.
- Higher inventory, theft and lower margins are punishing the stock.
- On the monthly chart, the next Fibonacci level that could work as support is near $108.

Dollar General (DG) is in the midst of a historic tumble in its share price. Since DG stock closed out November 2022 at $255.68, the downscale retailer has lost more than 50% of its market cap.
Dollar General’s large-scale earnings miss on August 31 didn’t help things either. DG stock cratered from the $150s to $130s in a single session and has continued its decline since then. So where might this contraction stop since value investors have long believed in the attractive growth prospects for Dollar General?
Dollar General stock news: High inventories, theft leads to barren outlook
Dollar General’s Q2 release arrived well below consensus forecasts on August 31. Dollar General reported $2.13 in GAAP earnings per share (EPS) – nearly 14% and $0.34 below consensus. Furthermore, revenue of $9.8 billion rose 4% YoY but missed consensus by $110 million.
Management blamed losses on a heavier than normal wave of theft, or “shrink” in the industry jargon, and plummeting margins. A good deal of the margin contraction came due to higher inventories that did not get worked off the books as fast as planned.
The full-year outlook was also scaled down significantly. CEO Jeff Owen said he expects net sales growth between 1.3% and 3.3% rather than the prior forecast of 3.5% to 5.0%. Net income was also revised lower by approximately 20% to 30% for the full year.
“We are frustrated by the magnitude of pressure on profits related to high inventory clearance (most of its peers controlled inventory well and had YoY declines in 2Q23) and shrink, as well as investment spending, including retail labor hours and permanent smart teams to improve operations and service levels in the stores,” brokerage firm Telsey Advisory Group wrote in a client note after the Q2 results, downgrading DG stock from Outperform to Market Perform.
Investment bank Raymond James cut its price target on DG stock from $200 to $160 in the aftermath of the earnings results, while Evercore ISI went a step further and cut its $185 price target to $150.
Dollar General stock forecast
Dollar General stock is trading in line with its covid low in March 2020 of $125. With such an extended sell-off that has already lasted about 10 months, many value investors are asking themselves what is the right price for entry.
At a 13 times trailing price-to-earnings ratio, which is much lower than its historical average of 21, Dollar General stock already looks cheap. Cheap stocks, however, can always get cheaper. The March 2020 low at $125 does look like it may hold, but if it doesn’t, then there are other options.
Based on the daily chart below, the Fibonacci Retracement shows DG stock breaking through the 361.8% Fibo in the past few sessions. The next barrier comes at the 423.6% Fibo at $120.39, which could make for a respectable entry.
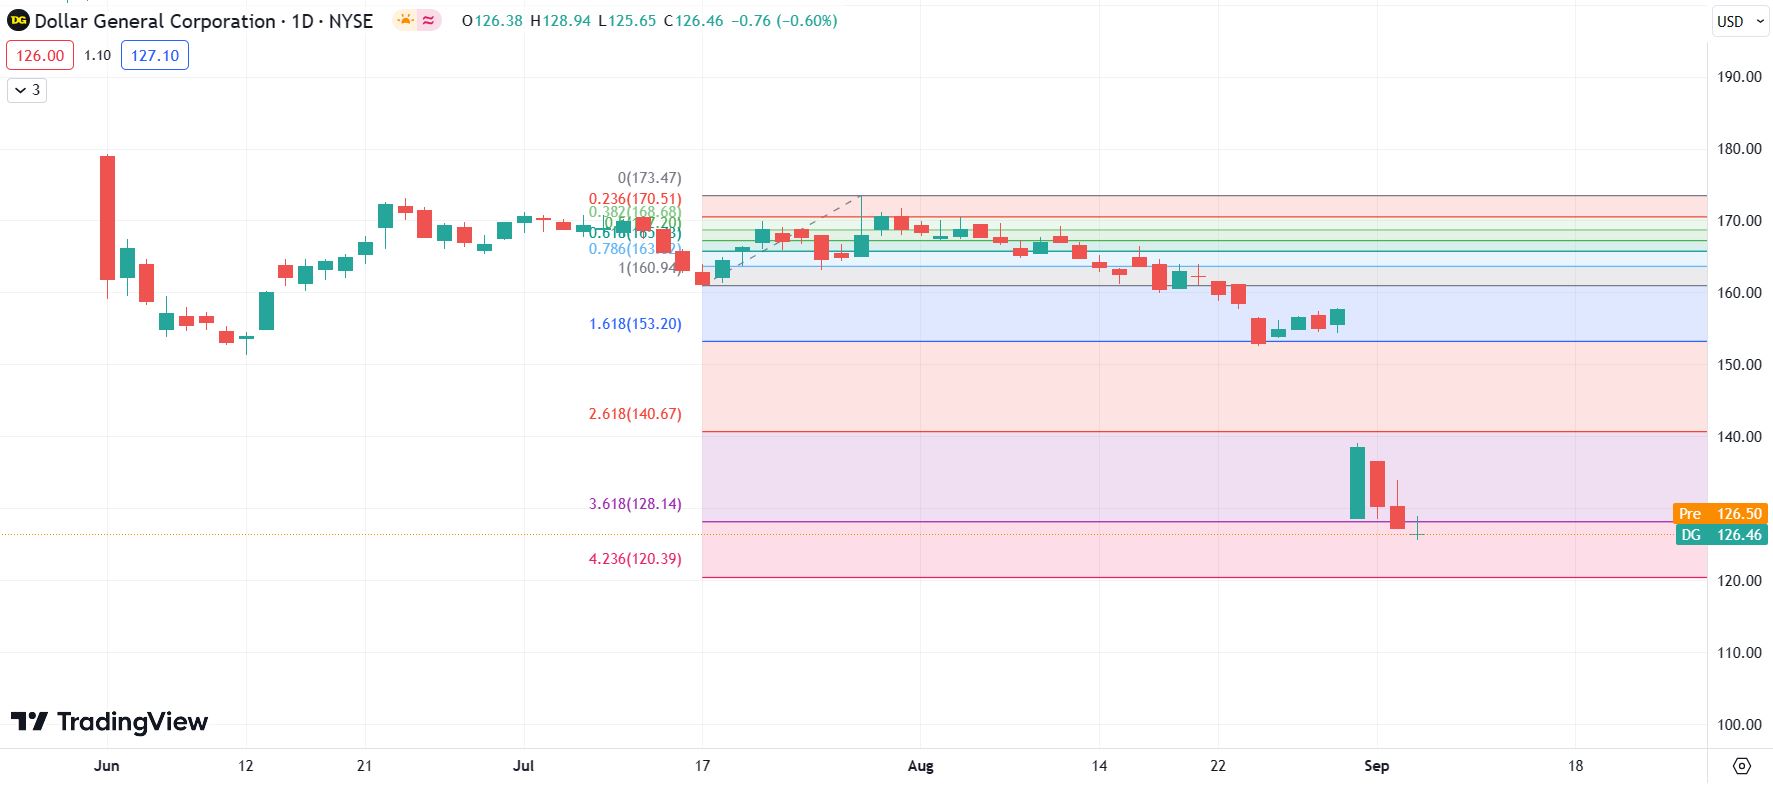
DG daily chart
If, however, $125 and $120.39 fail to provide support, then Dollar General stock may have much further to fall. The 78.6% Fibo on the monthly chart could give us a clue. It arrives just under $108, a price level that DG investors have not seen since January 2019. This level may seem unlikely since it is so far off the stock’s highs in the low $260s less than a year ago, but then again no one thought Dollar General stock would break historical support at $187 either.
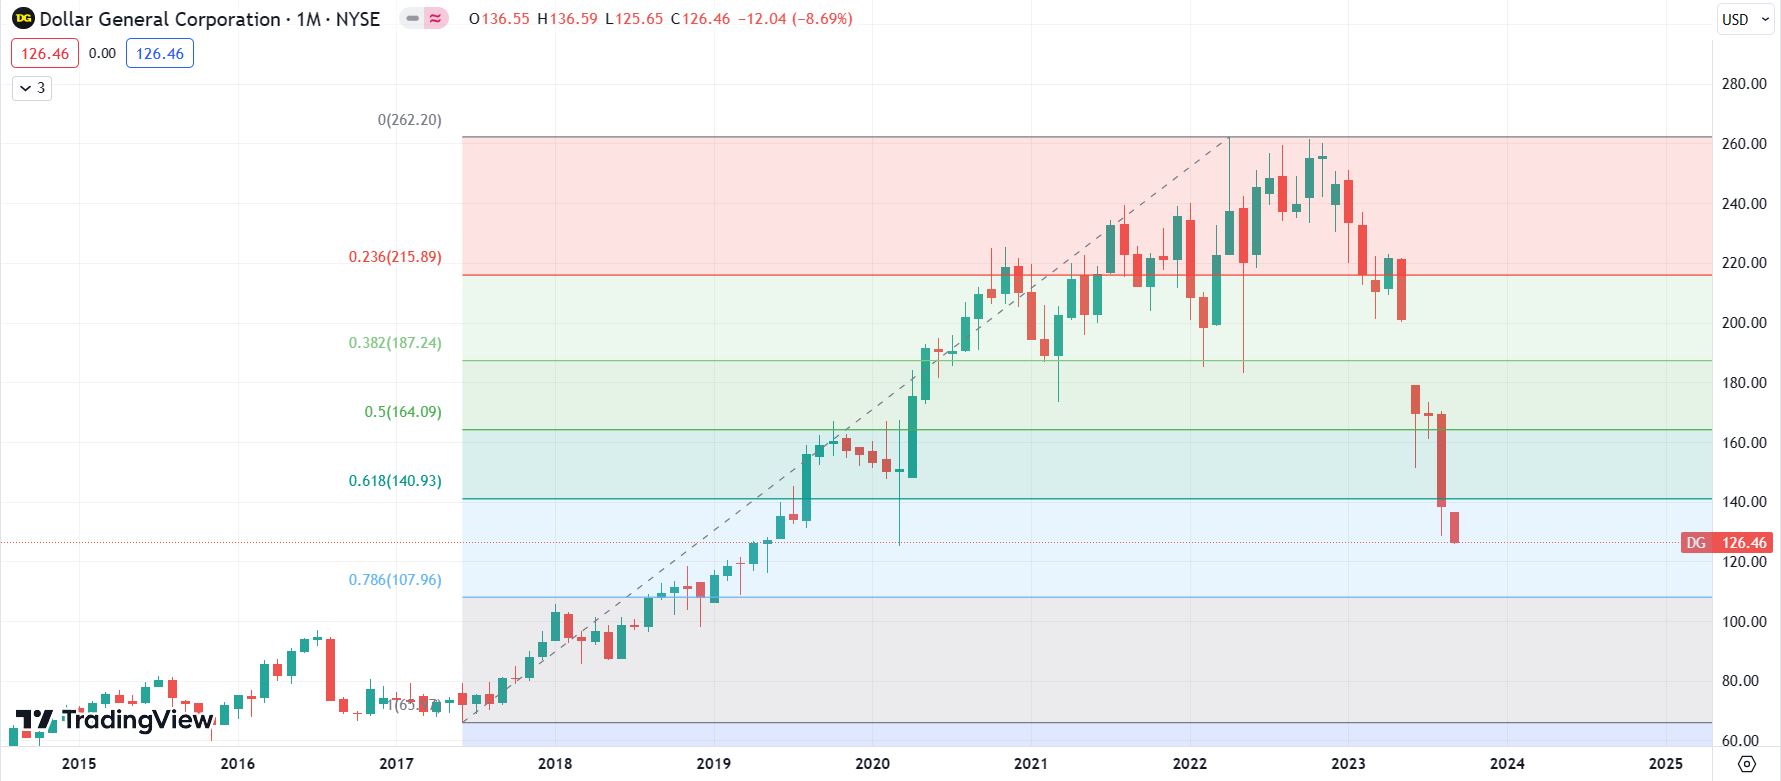
DG monthly chart
Premium
You have reached your limit of 3 free articles for this month.
Start your subscription and get access to all our original articles.
Author

Clay Webster
FXStreet
Clay Webster grew up in the US outside Buffalo, New York and Lancaster, Pennsylvania. He began investing after college following the 2008 financial crisis.


