Costco Earnings Preview: Can COST stock stop the drop?


  • Costco is due to report earnings on Thursday after the close.
  • COST stock continues to outperform the main indices.
  • COST has seen analysts revise their earnings forecasts.

Costco (COST) reports earnings after the close on Thursday, and getting a handle on how it will look is difficult. The stock has outperformed the main indices this year. COST is down 13% so far in 2022, while the indices are down at least 20%.

COST stock news

Analysts have recently been upgrading estimates for current earnings. Yes, upgrading is a relatively unusual move given the recent turmoil in the retail sector. With consumers opting through for lower-cost alternatives, Costco could benefit from low-cost switching. This does set up the possibility of COST being more likely to surprise to the downside than upside. Analysts are naturally bullish, but this looks a step too far with not one Sell rating from Wall Street. Since last quarter upgrades have outpaced downgrades by a 3-to-1 ratio. This is despite last quarter's earnings merely being in line.

For this quarter the bar is now set at $4.17 for EPS and $72 billion for revenue, so I expect a miss. How will the stock react? What is priced in? Here is where it gets difficult. COST is off 13% in the past month as retailers feel the brunt of anticipated demand shortfalls and consumer pullbacks. This makes it difficult to see much risk reward here. In fact with the stock off 13% in a month, any beat is likely to see a more extreme reaction. This is the risk-reward even though I deem it unlikely. 

COST stock forecast

Again trading to the bottom of recent ranges. The overall picture is bearish, but the potential for a sharp spike in good news is probably higher than an earnings miss and resultant sell-off. $507 is the short-term pivot.
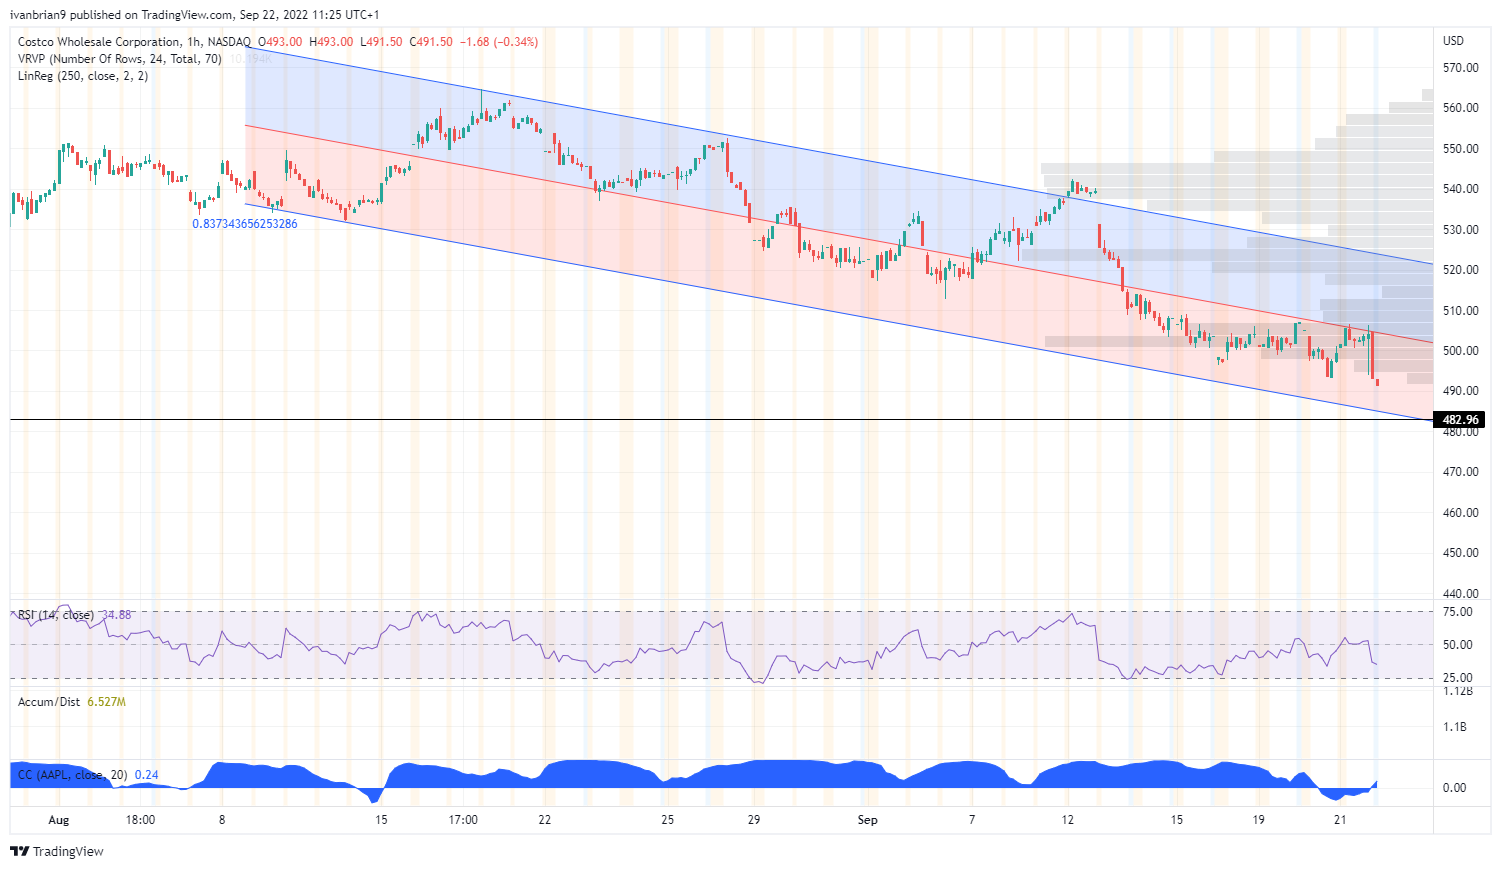
COST hourly chart

$490 to $482 is the support zone. Breaking here will likely lead to a test of lows at $406.51 from June. So far this recent decline has not seen a corresponding fall in the Dccumulation/Distribution line, which is a bullish divergence indicator but a weak one.
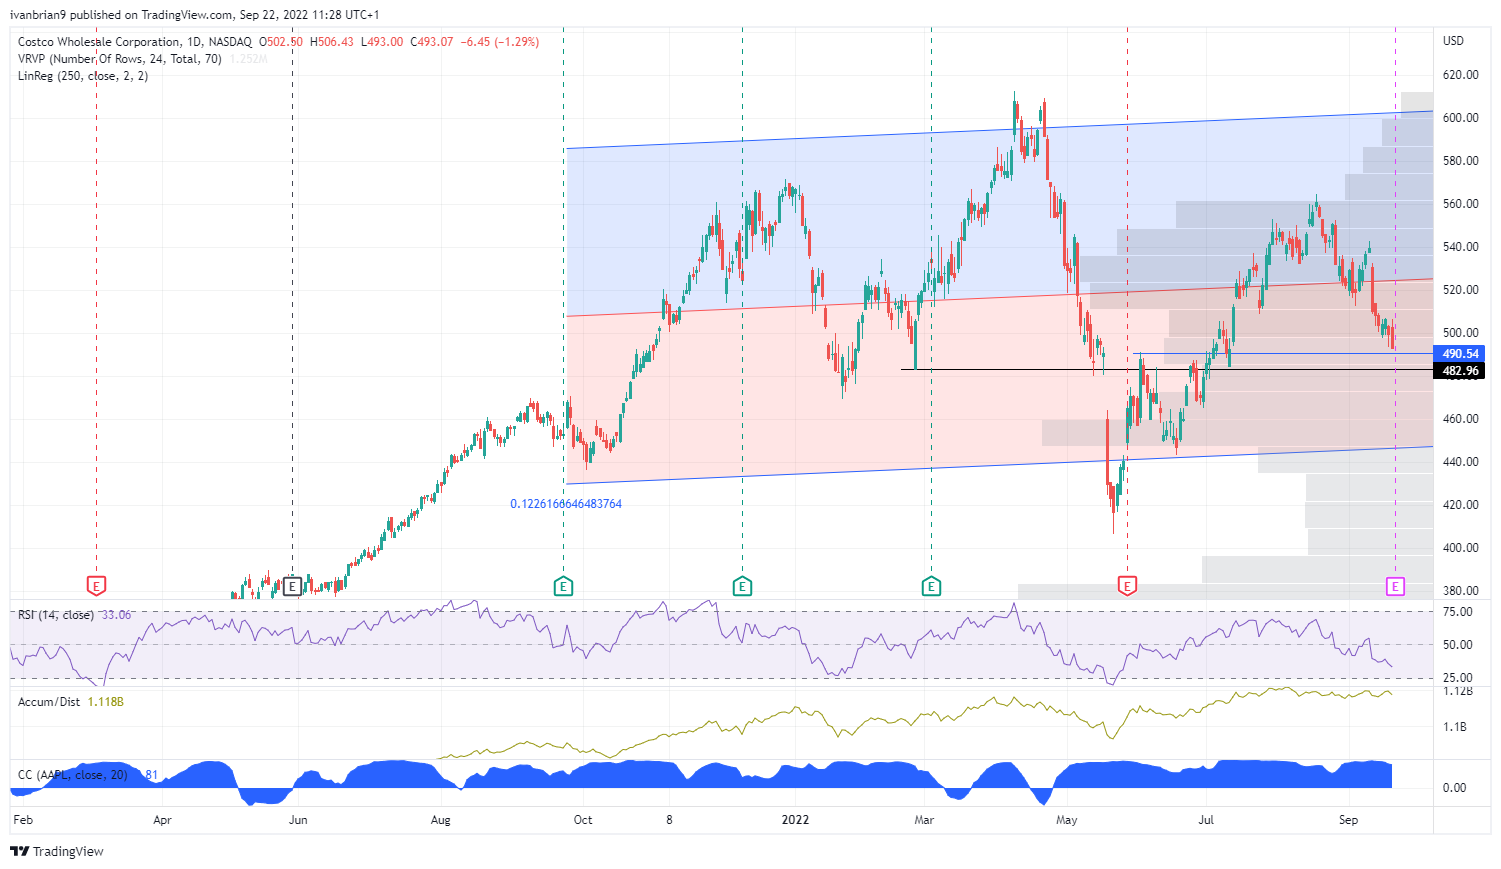
COST daily chart

Share: Feed news

Information on these pages contains forward-looking statements that involve risks and uncertainties. Markets and instruments profiled on this page are for informational purposes only and should not in any way come across as a recommendation to buy or sell in these assets. You should do your own thorough research before making any investment decisions. FXStreet does not in any way guarantee that this information is free from mistakes, errors, or material misstatements. It also does not guarantee that this information is of a timely nature. Investing in Open Markets involves a great deal of risk, including the loss of all or a portion of your investment, as well as emotional distress. All risks, losses and costs associated with investing, including total loss of principal, are your responsibility. The views and opinions expressed in this article are those of the authors and do not necessarily reflect the official policy or position of FXStreet nor its advertisers. The author will not be held responsible for information that is found at the end of links posted on this page.

If not otherwise explicitly mentioned in the body of the article, at the time of writing, the author has no position in any stock mentioned in this article and no business relationship with any company mentioned. The author has not received compensation for writing this article, other than from FXStreet.

FXStreet and the author do not provide personalized recommendations. The author makes no representations as to the accuracy, completeness, or suitability of this information. FXStreet and the author will not be liable for any errors, omissions or any losses, injuries or damages arising from this information and its display or use. Errors and omissions excepted.

The author and FXStreet are not registered investment advisors and nothing in this article is intended to be investment advice.

Recommended content


Recommended content

Editors’ Picks

EUR/USD alternates gains with losses near 1.0720 post-US PCE

EUR/USD alternates gains with losses near 1.0720 post-US PCE

The bullish tone in the Greenback motivates EUR/USD to maintain its daily range in the low 1.070s in the wake of firmer-than-estimated US inflation data measured by the PCE.

EUR/USD News

GBP/USD clings to gains just above 1.2500 on US PCE

GBP/USD clings to gains just above 1.2500 on US PCE

GBP/USD keeps its uptrend unchanged and navigates the area beyond 1.2500 the figure amidst slight gains in the US Dollar following the release of US inflation tracked by the PCE.

GBP/USD News

Gold keeps its daily gains near $2,350 following US inflation

Gold keeps its daily gains near $2,350 following US inflation

Gold prices maintain their constructive bias around $2,350 after US inflation data gauged by the PCE surpassed consensus in March and US yields trade with slight losses following recent peaks.

Gold News

Bitcoin Weekly Forecast: BTC’s next breakout could propel it to $80,000 Premium

Bitcoin Weekly Forecast: BTC’s next breakout could propel it to $80,000

Bitcoin’s recent price consolidation could be nearing its end as technical indicators and on-chain metrics suggest a potential upward breakout. However, this move would not be straightforward and could punish impatient investors. 

Read more

Week ahead – Hawkish risk as Fed and NFP on tap, Eurozone data eyed too

Week ahead – Hawkish risk as Fed and NFP on tap, Eurozone data eyed too

Fed meets on Wednesday as US inflation stays elevated. Will Friday’s jobs report bring relief or more angst for the markets? Eurozone flash GDP and CPI numbers in focus for the Euro.

Read more

Forex MAJORS

Cryptocurrencies

Signatures