|
Coke (KO) long term structures and key levels

The Coca-Cola Company is an American multinational beverage corporation founded in 1892, best known as the producer of Coca-Cola. The Coca-Cola Company (KO) also manufactures, sells, and markets other non-alcoholic beverage concentrates and syrups, and alcoholic beverages.
In this blog we are going to analyze the possible Elliott Wave structures that could occur in the long term in KO shares and the different prices that must be considered when making trading decisions.
The first impulse since the beginnings of the company ended in 1998 and we labeled it as the wave ((I)). The retracement of this movement ended in 2003 and KO continued the rally. By the year of 2020 a new impulse ended and we labeled it as wave (I) and by March of the same year we had a strong pullback due to the COVID 19 pandemic. This pullback reached 36.27 as wave (II) and continued with the rally. The next rally ended at the price of 67.20 as wave I and from here we are going to analyze the different long-term alternatives.
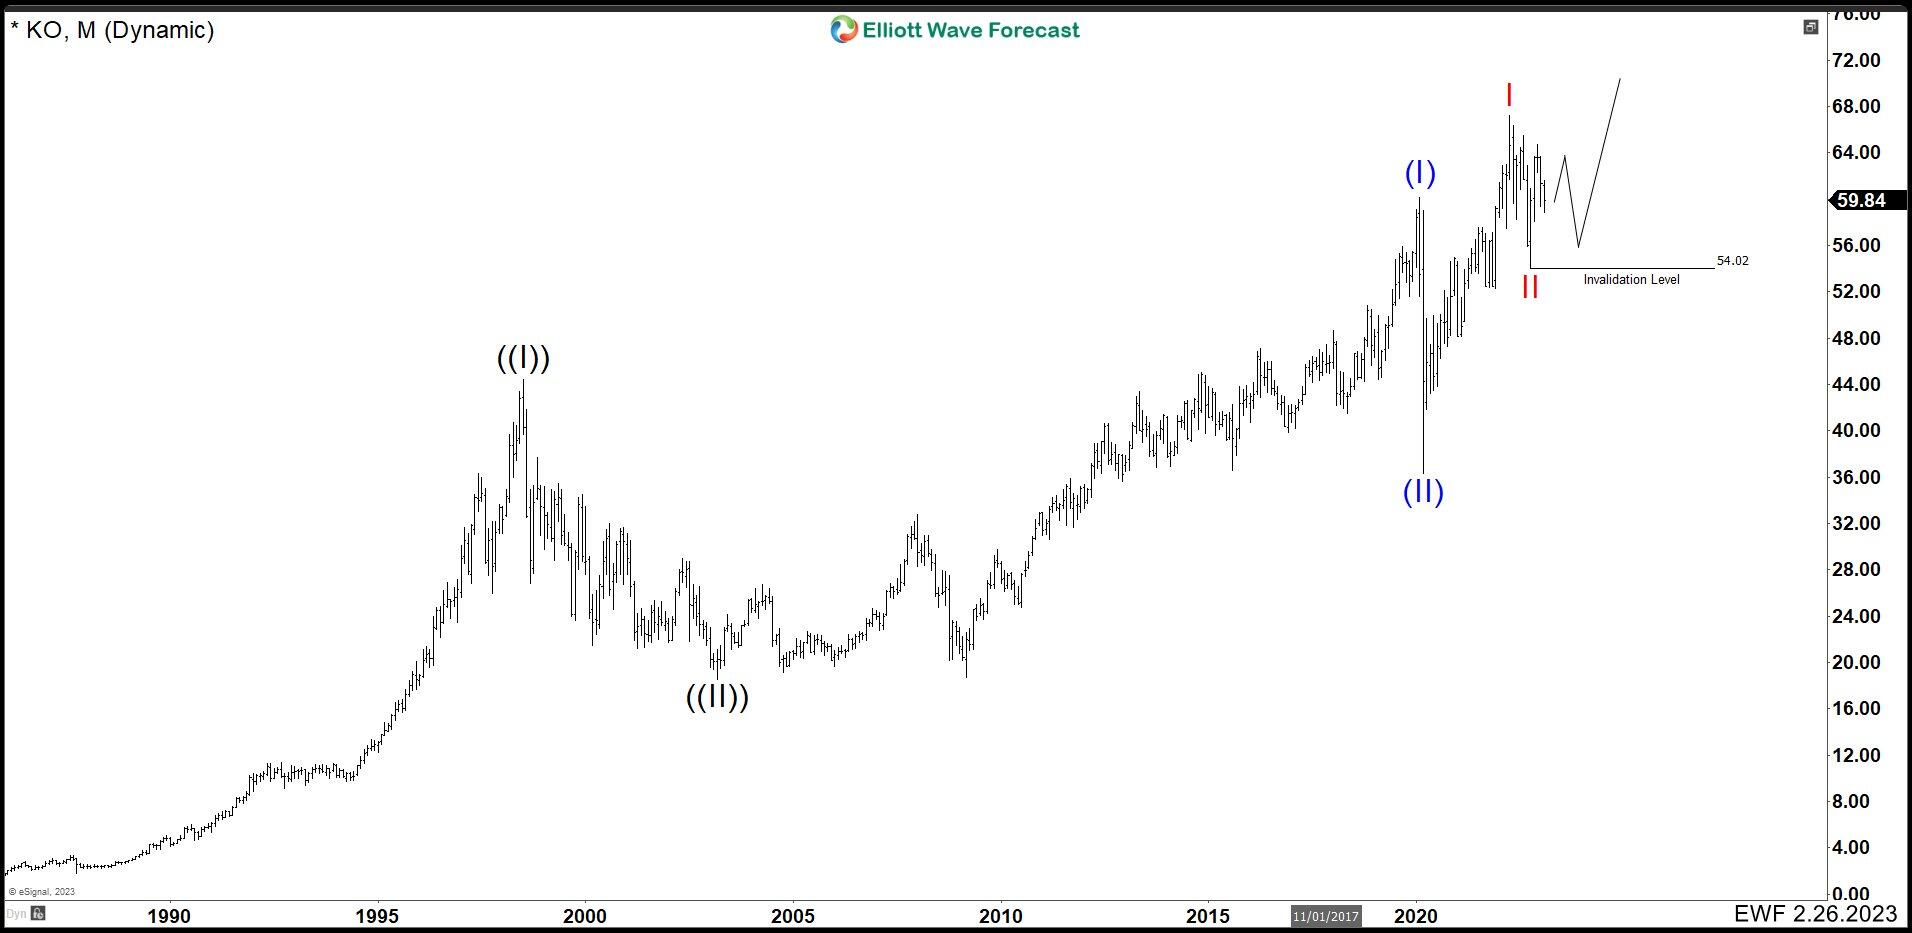
KO Montly Chart. Agressive Bullish Continuation

This chart makes an aggressive bullish continuation count. This structure is simple to determine. We just need to break through 67.20 and see an impulse higher to complete wave ((1)). If this happens, then we would have a bull market for the whole year 2023 before having a wave ((2)) retracement.
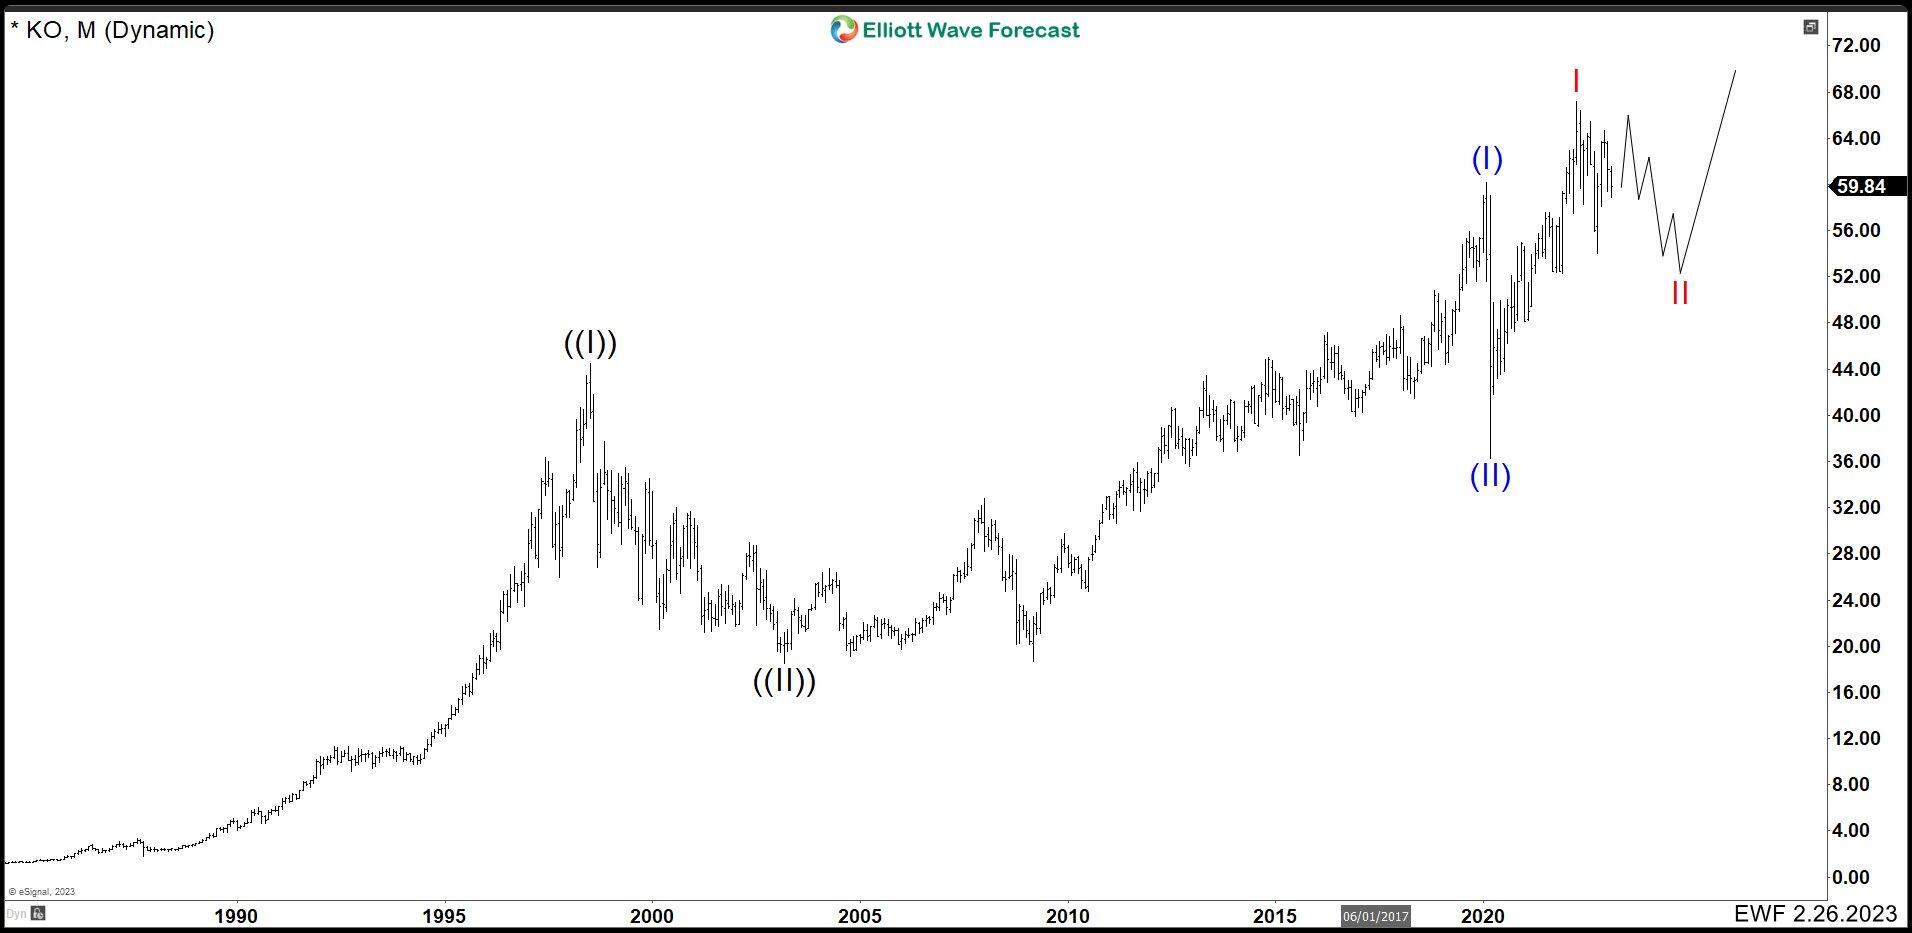
KO Montly Chart. Pullback and Bullish Continuation
In this chart we also expect to continue rising. However, the difference with the previous one is that KO does not break above 67.20. We will first need to see a correction that holds above 54.02 before continuing the rally.
KO Montly Chart. Wave II No Completed
In the following structure wave II has not finished yet. We need KO to break below 54.02 to complete it. We must watch here, it is the formation of a bearish impulse with price breaking of 54.02 before looking for buy opportunities. (If you want to learn more about Elliott Wave Theory, please follow these links: Elliott Wave Education and Elliott Wave Theory).
KO Montly Chart. Recession Structure
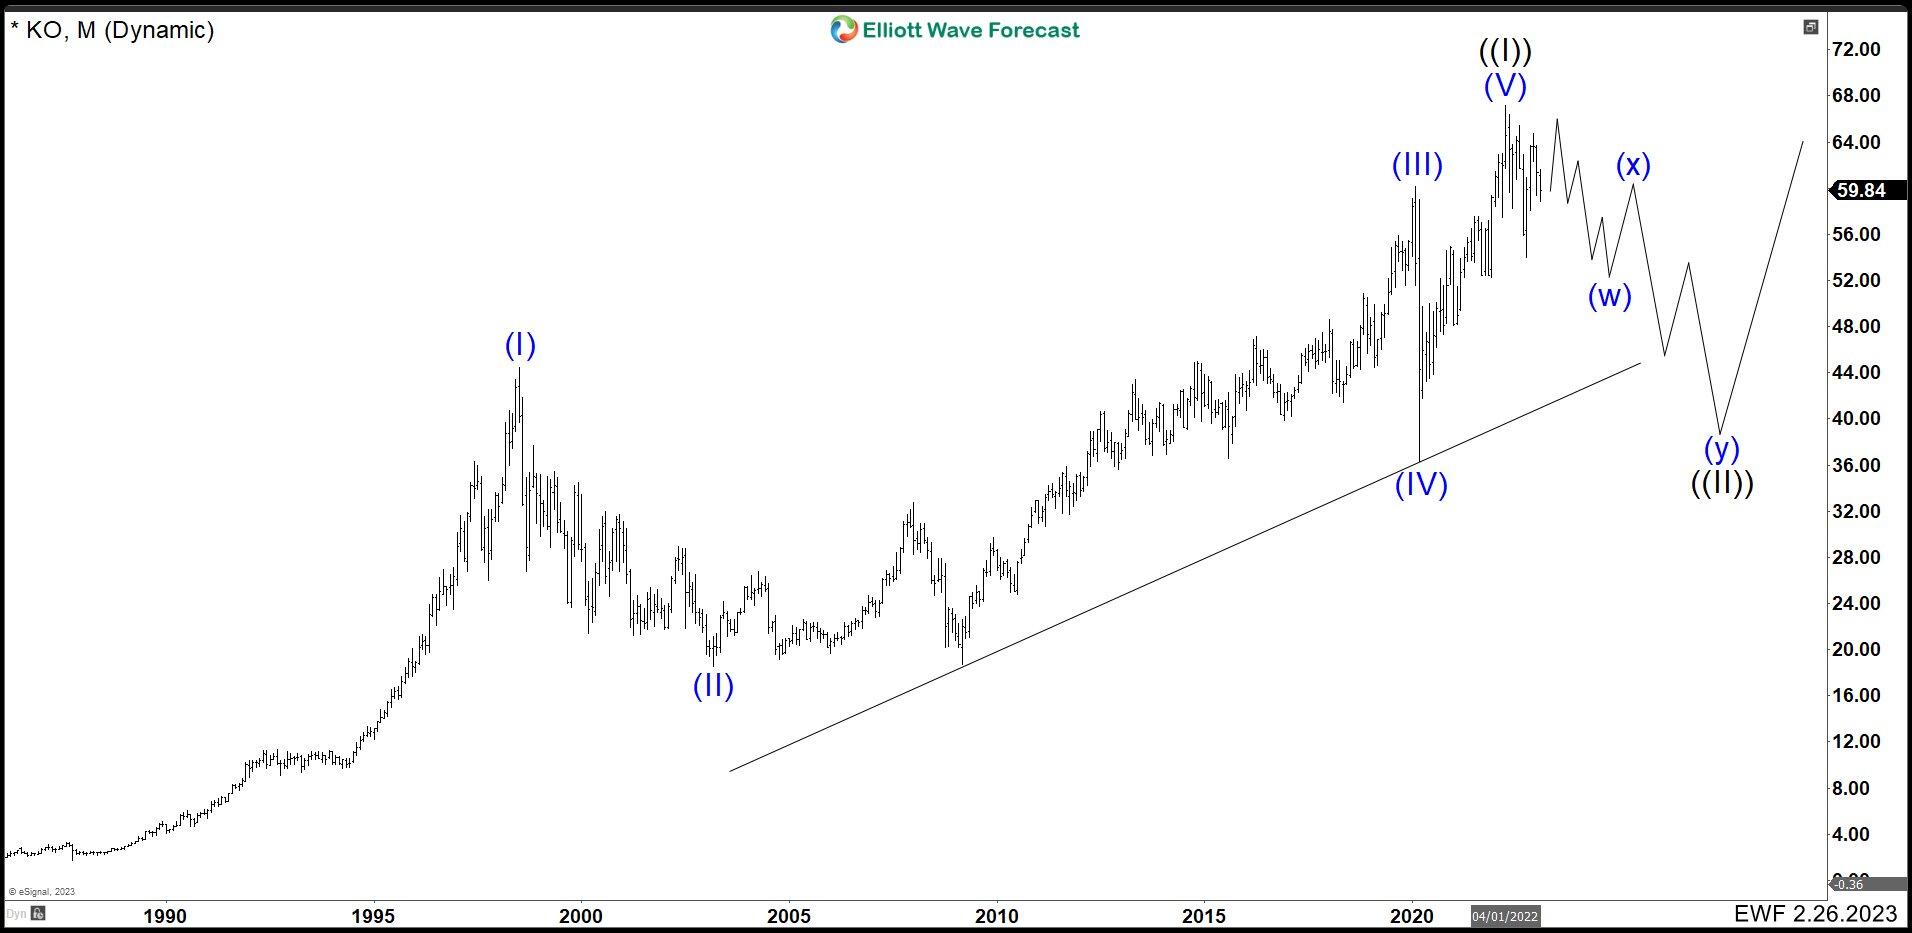
This last structure is recessive. The 5 bullish waves form a leading diagonal ending at 67.20 as wave ((I)). Therefore, the pullback from this level should be much deeper. This would happen as long as when KO breaks below the 54.02 level and it doesn’t have enough buyers to break through 67.20 again. This would result in a sharp drop for this stock.
Author

Elliott Wave Forecast Team
ElliottWave-Forecast.com
More from Elliott Wave Forecast Team


