Canadian Dollar declined on data-light Tuesday as US markets return to the fold
- US markets return after long weekend, Fedspeak to dominate.
- Canadian Dollar recedes as investors shrug off low-tier CAD data.
- Canada saw an uptick in industrial and raw materials inflation in April.

The Canadian Dollar (CAD) is broadly softer on Tuesday, paring away some of the gains found at the start of the trading week. Fedspeak is set to dominate the headlines as investors buckle down for the long wait to US Gross Domestic Product (GDP) and Personal Consumption Expenditure (PCE) inflation due on Thursday and Friday, respectively.
Canada reported an uptick in industrial inflation in April to little market reaction as investors focus on statements from Federal Reserve (Fed) officials. Broad market sentiment took a hit last week after markets were forced to re-price odds of a September rate cut, and traders are looking for firmer signs of rate cut plans from Fed central planners.
Daily digest market movers: Canadian producer-level inflation ticks higher once again
- Canadian Industrial Product Prices rose 1.5% MoM in April, reversing the forecasted decline to 0.6% from the previous 0.9%.
- Canadian Raw Material Price Index also accelerated in April, rising 5.5% against the previous month’s 4.3% (revised down from 4.7%). Median market forecasts had expected a print of 3.2%.
- Comments from Fed officials continue to dominate the market as investors continue to hope for signs of interest rate cuts despite a firmly cautious lean from policymakers.
- Canadian Current Account slated for Thursday to be overshadowed by US Q1 GDP, while market reactions to Canadian Q1 GDP on Friday will be entirely engulfed by US PCE Price Index inflation.
- Markets are expecting a downturn in US GDP, while US PCE inflation is forecast to hold in-line with previous figures, but rate cut hopes could be tainting the picture.
Canadian Dollar PRICE Today
The table below shows the percentage change of Canadian Dollar (CAD) against listed major currencies today. Canadian Dollar was the weakest against the Swiss Franc.
| USD | EUR | GBP | JPY | CAD | AUD | NZD | CHF | |
|---|---|---|---|---|---|---|---|---|
| USD | -0.01% | 0.05% | 0.16% | 0.07% | 0.04% | 0.07% | -0.17% | |
| EUR | 0.00% | 0.06% | 0.17% | 0.07% | 0.06% | 0.11% | -0.15% | |
| GBP | -0.05% | -0.06% | 0.12% | 0.00% | 0.01% | 0.06% | -0.21% | |
| JPY | -0.16% | -0.17% | -0.12% | -0.08% | -0.10% | -0.03% | -0.29% | |
| CAD | -0.07% | -0.07% | 0.00% | 0.08% | -0.03% | 0.03% | -0.23% | |
| AUD | -0.04% | -0.06% | -0.01% | 0.10% | 0.03% | 0.06% | -0.23% | |
| NZD | -0.07% | -0.11% | -0.06% | 0.03% | -0.03% | -0.06% | -0.27% | |
| CHF | 0.17% | 0.15% | 0.21% | 0.29% | 0.23% | 0.23% | 0.27% |
The heat map shows percentage changes of major currencies against each other. The base currency is picked from the left column, while the quote currency is picked from the top row. For example, if you pick the Canadian Dollar from the left column and move along the horizontal line to the US Dollar, the percentage change displayed in the box will represent CAD (base)/USD (quote).
Technical analysis: Canadian Dollar hits a wall, stumbles back
The Canadian Dollar (CAD) is broadly softer on Tuesday, shedding weight across the board and holding flat against the battered Japanese Yen (JPY) as the day’s strongest pair performance from the CAD. Despite broad-spectrum weakness from the Canadian Dollar, pullbacks remain limited, with the CAD trading within a fifth of a percent against nearly all of its major peers.
USD/CAD rebounded to test 1.3650 after arresting a decline below 1.3620, and the 1.3600 handle is firming into a technical barrier rather than a target for short pressure. The pair is still down 0.8% from last week’s peak just above 1.3740, and daily candlesticks are mired in technical congestion near the 50-day Exponential Moving Average (EMA) at 1.3642.
USD/CAD hourly chart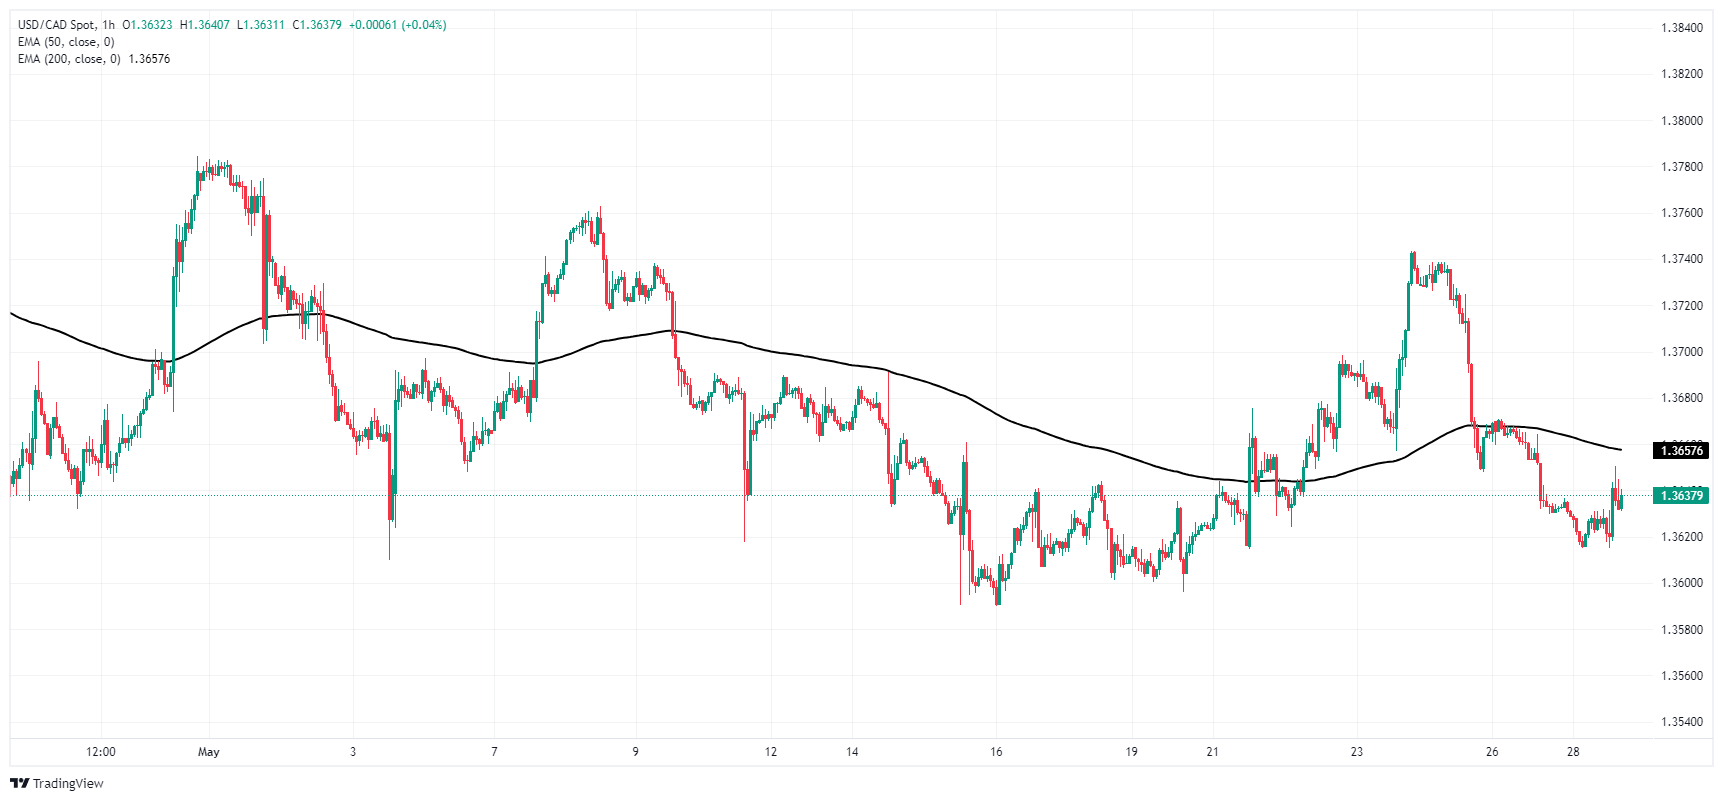
USD/CAD daily chart
GDP FAQs
A country’s Gross Domestic Product (GDP) measures the rate of growth of its economy over a given period of time, usually a quarter. The most reliable figures are those that compare GDP to the previous quarter e.g Q2 of 2023 vs Q1 of 2023, or to the same period in the previous year, e.g Q2 of 2023 vs Q2 of 2022. Annualized quarterly GDP figures extrapolate the growth rate of the quarter as if it were constant for the rest of the year. These can be misleading, however, if temporary shocks impact growth in one quarter but are unlikely to last all year – such as happened in the first quarter of 2020 at the outbreak of the covid pandemic, when growth plummeted.
A higher GDP result is generally positive for a nation’s currency as it reflects a growing economy, which is more likely to produce goods and services that can be exported, as well as attracting higher foreign investment. By the same token, when GDP falls it is usually negative for the currency. When an economy grows people tend to spend more, which leads to inflation. The country’s central bank then has to put up interest rates to combat the inflation with the side effect of attracting more capital inflows from global investors, thus helping the local currency appreciate.
When an economy grows and GDP is rising, people tend to spend more which leads to inflation. The country’s central bank then has to put up interest rates to combat the inflation. Higher interest rates are negative for Gold because they increase the opportunity-cost of holding Gold versus placing the money in a cash deposit account. Therefore, a higher GDP growth rate is usually a bearish factor for Gold price.
Author

Joshua Gibson
FXStreet
Joshua joins the FXStreet team as an Economics and Finance double major from Vancouver Island University with twelve years' experience as an independent trader focusing on technical analysis.


