C3.ai Earnings: AI stock surges 17% on EPS beat
- C3.ai reported an earnings, revenue beat for FQ3.
- AI stock jumped 17% on the news.
- NASDAQ futures have risen 0.3% on Friday.
- C3.ai has switched to a consumption-based model.

C3.ai (AI) saw its revenue fall YoY in the fiscal third quarter, but the enterprise-focused artifical intelligence software company managed to beat Wall Street consenus late Thursday, which was enough for it to power more than 16% higher in Friday's premarket. The stock is up more than 17% at the time of writing at just under $25.
C3.ai earnings news
C3.ai reported adjusted earnings per share (EPS) of $-0.06 on revenue of $66.7 million. This proved to outperform Wall Street's forecast for a 22 cent adjusted loss. Revenue also came in ahead of the $64.25 million estimate from analysts.
However, sales fell more than 4% from the same period last year as the company switched to a consumption-based model. CEO Thomas Siebel was quick to say that much of the difficulty was felt in the summer of 2022 and that the fiscal third quarter, which ended in January, saw the first signs of a change in customer attitudes.
"Now as we enter into our fourth quarter, we are seeing tailwinds from improved business optimism and increased interest in applying C3 AI solutions to address an increasing range of applications across a broadening set of industries," said Thomas Siebel. "This is a dramatic change from what we experienced in mid-2022. There is a genuine optimism in the marketplace for our solutions. And the overall business sentiment appears to be substantially improving."
Siebel boasted that the company now had 290 pilot projects with potential clients. This figure is higher than the company's current corporate client list of 236.
For the fiscal fourth quarter, which runs from February through April, C3.ai projected a return to growth with revenue between $70 million and $72 million.
C3.ai stock forecast
AI stock has been in a bearish trend since the Moving Average Convergence Divergence (MACD) indicator crossed over on February 17. Just Wednesday the 9-day moving average also swooped below its 21-day counterpart. Friday's premarket price around $25, however, means that the stock is now trading slightly above earlier resistance around the $24.23 pivot. Bulls will see it as their birthright to push AI stock at least up to the next resistance point at $28, which was reached on several occasions in early February. Bulls will also be eyeing the February 6 range high of $30.92. Expect $17.50 to still hold if things turn south for AI stock during the rest of March.
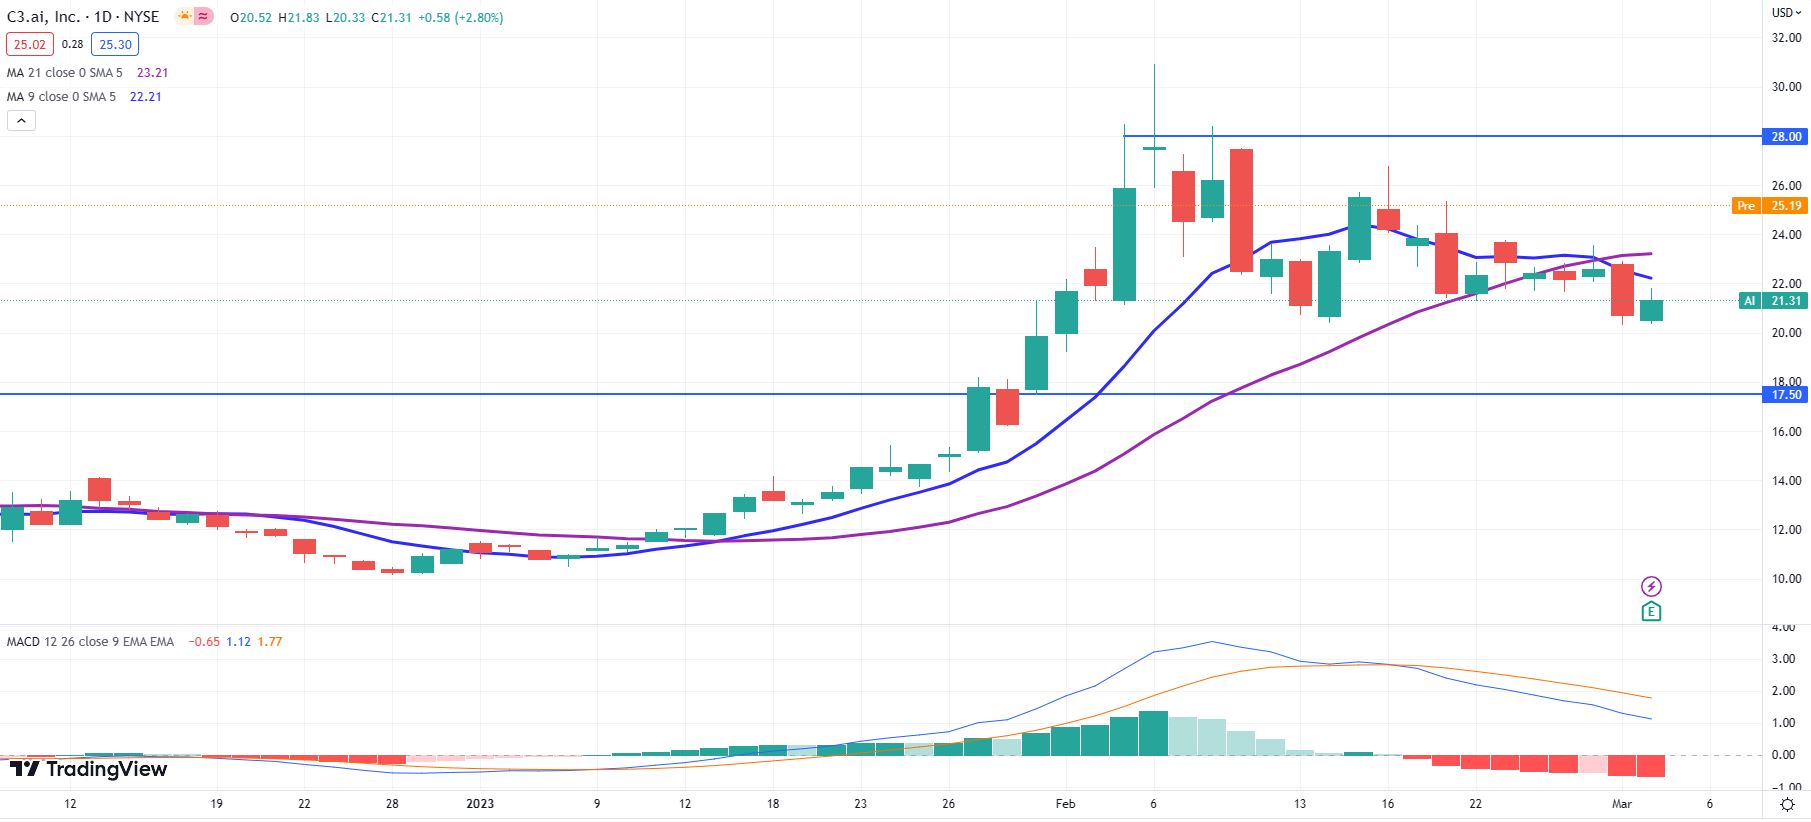
AI stock chart
Author

Clay Webster
FXStreet
Clay Webster grew up in the US outside Buffalo, New York and Lancaster, Pennsylvania. He began investing after college following the 2008 financial crisis.