|

Brent technical analysis: 200-day EMA exerts downside pressure towards $63.15/10

  • Brent Oil’s latest recovery fails to cross 200-day EMA.
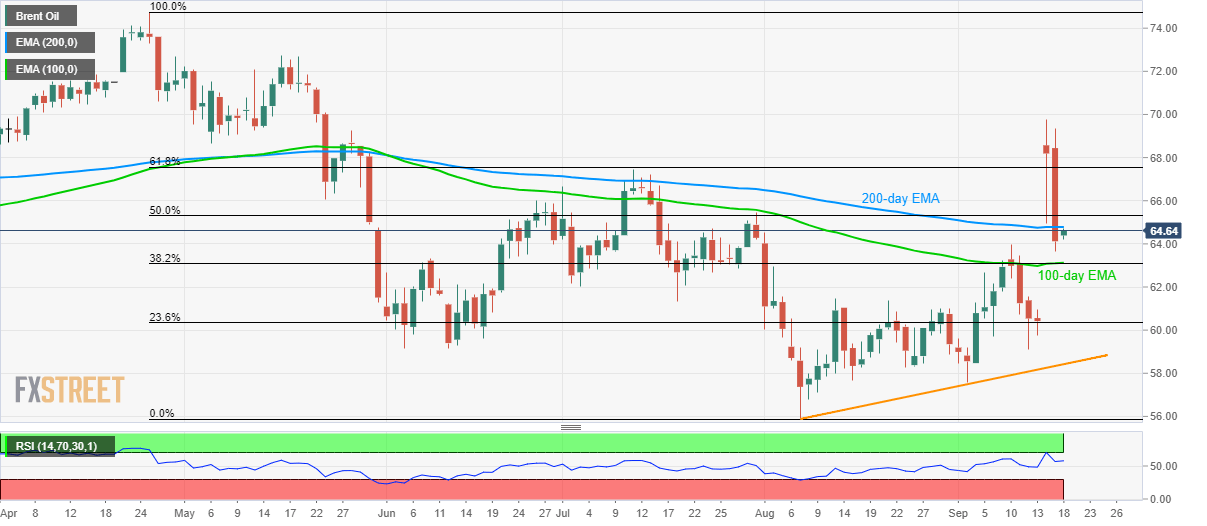
  • 100-day EMA, 38.2% Fibonacci retracement becomes key support to watch.

Irrespective of Brent’s latest bounce off $64.20, the black gold remains below the 200-day exponential moving average (EMA) while taking rounds to $64.65 ahead of the London open on Wednesday.

The British oil benchmark’s sustained trading below key EMA increases the odds of its further declines towards 100-day EMA, 38.2% Fibonacci retracement of April-August drop, near $63.15/10.

In a case where bears dominate past-$63.10, multiple tops flashed during early-August can lure them to $61.50/40 support-area.

Meanwhile, a successful break above 200-day EMA level of $64.80 needs to overcome a 50% Fibonacci retracement level of $65.30 in order to aim for July month high of $67.45.

Additionally, buyers’ ability to cross $67.45 on a daily closing basis can renew hopes for the run-up towards latest high surrounding $69.80.

Brent Oil daily chart

Trend: bearish

additional important levels

Overview
Today last price64.6
Today Daily Change0.48
Today Daily Change %0.75%
Today daily open64.12
 
Trends
Daily SMA2061.02
Daily SMA5061.59
Daily SMA10063.73
Daily SMA20064.06
Levels
Previous Daily High69.36
Previous Daily Low63.66
Previous Weekly High63.98
Previous Weekly Low59.1
Previous Monthly High64.54
Previous Monthly Low55.88
Daily Fibonacci 38.2%65.84
Daily Fibonacci 61.8%67.18
Daily Pivot Point S162.07
Daily Pivot Point S260.01
Daily Pivot Point S356.37
Daily Pivot Point R167.77
Daily Pivot Point R271.41
Daily Pivot Point R373.47

Author

Anil Panchal

Anil Panchal

FXStreet

Anil Panchal has nearly 15 years of experience in tracking financial markets. With a keen interest in macroeconomics, Anil aptly tracks global news/updates and stays well-informed about the global financial moves and their implications.

More from Anil Panchal
Share:

Editor's Picks

EUR/USD challenges 1.1800, two-week lows

EUR/USD remains on the defensive, extending its leg lower to the vicinity of the 1.1800 region, or two-week lows, on Tuesday. The move lower comes as the US Dollar gathers further traction ahead of key US data releases, inclusing the FOMC Minutes, on Wednesday.

GBP/USD looks weaker near 1.3500

GBP/USD adds to Monday’s pessimism and puts the 1.3500 support to the test on Tuesday. Cable’s marked pullback comes in response to extra gains in the Greenback while disappointing UK jobs data also collaborate with the offered bias around the British Pound.

Gold loses further momentum, approaches $4,800

Gold recedes to fresh two-week troughs around the $4,800 region per troy ounce on Tuesday. The precious metal builds on Monday’s downtick following a marked rebound in the US Dollar and mixed US Treasury yields across the board.

Crypto Today: Bitcoin, Ethereum, XRP upside looks limited amid deteriorating retail demand

The cryptocurrency market extends weakness with major coins including Bitcoin (BTC), Ethereum (ETH) and Ripple (XRP) trading in sideways price action at the time of writing on Tuesday.

UK jobs market weakens, bolstering rate cut hopes

In the UK, the latest jobs report made for difficult reading. Nonetheless, this represents yet another reminder for the Bank of England that they need to act swiftly given the collapse in inflation expected over the coming months. 

Ripple slides to $1.45 as downside risks surge

Ripple edges lower at the time of writing on Tuesday, from the daily open of $1.48, as headwinds persist across the crypto market. A short-term support is emerging at $1.45, but a buildup of bearish positions could further weaken the derivatives market and prolong the correction.