Gold drops to two-week low as firmer USD weighs
- Gold trades under pressure on Tuesday, hovering below the $5,000 mark amid thin liquidity.
- Diminishing prospects for imminent Fed easing support the USD, pressuring Bullion.
- Technically, XAU/USD tests crucial support as it weakens below the 100-SMA on the 4-hour chart.

Gold (XAU/USD) trades on the back foot on Tuesday as holiday-thinned volumes weigh on sentiment. At the time of writing, XAU/USD is trading at $4,863 near two-week lows, down 2.50 % on the day.

Liquidity remains light as Lunar New Year holidays keep China and several Asian markets closed, with Chinese markets set to reopen only next Tuesday. Trading volumes are likely to pick up in the American session as traders return from the long weekend after US markets were shut on Monday for Presidents’ Day.
The metal is also facing pressure from a firmer US Dollar (USD) and a rebound in Treasury yields. The US Dollar Index (DXY), which tracks the Greenback’s performance against a basket of six major currencies, is trading around 97.44, up nearly 0.37%.
On the data front, the NY Empire State Manufacturing Index rose to 7.1 in February, beating market expectations of 6.0, though easing slightly from the previous reading of 7.7. Meanwhile, the ADP Employment Change four-week average increased to 10.3K, up from a revised 7.8K (previously 6.5K).
Fed interest rate-cut timing in focus as recent US data reshapes expectations
Bullion appears to be in a holding pattern, with traders reluctant to chase prices in either direction as mixed macroeconomic signals cloud the near-term outlook. Market participants are reassessing the timing of Federal Reserve (Fed) interest-rate cuts following last week’s US economic releases.
Stronger-than-expected US labor data tempered expectations for an imminent interest-rate cut, while softer inflation readings reinforced the view that the Fed could resume easing in the second half of the year.
Traders are pricing in nearly 60 basis points (bps) of easing this year, with the CME FedWatch Tool indicating the first rate cut could come in June. Dovish Fed expectations tend to support Gold, as the non-yielding metal typically benefits from a lower interest-rate environment.
US-Iran tensions and military risks keep safe-haven demand intact
Beyond monetary policy, persistent geopolitical tensions continue to lend support to the yellow metal, reinforcing its appeal as a safe-haven asset. A high-stakes second round of US-Iran nuclear talks was held earlier on Tuesday in Geneva. Iran’s Foreign Minister stated that both sides had reached an understanding on the main principles with the United States.
Meanwhile, military risks remain elevated after reports on Monday that Iran’s Revolutionary Guard launched exercises in the Strait of Hormuz, as US forces remain heavily deployed across the Middle East.
Looking ahead, focus will then turn to the Federal Open Market Committee (FOMC) Meeting Minutes on Wednesday, followed by the core Personal Consumption Expenditures (PCE) Price Index and the advance estimate of fourth-quarter US Gross Domestic Product (GDP) on Friday.
Technical analysis: XAU/USD trades with a mild negative bias on the 4-hour chart
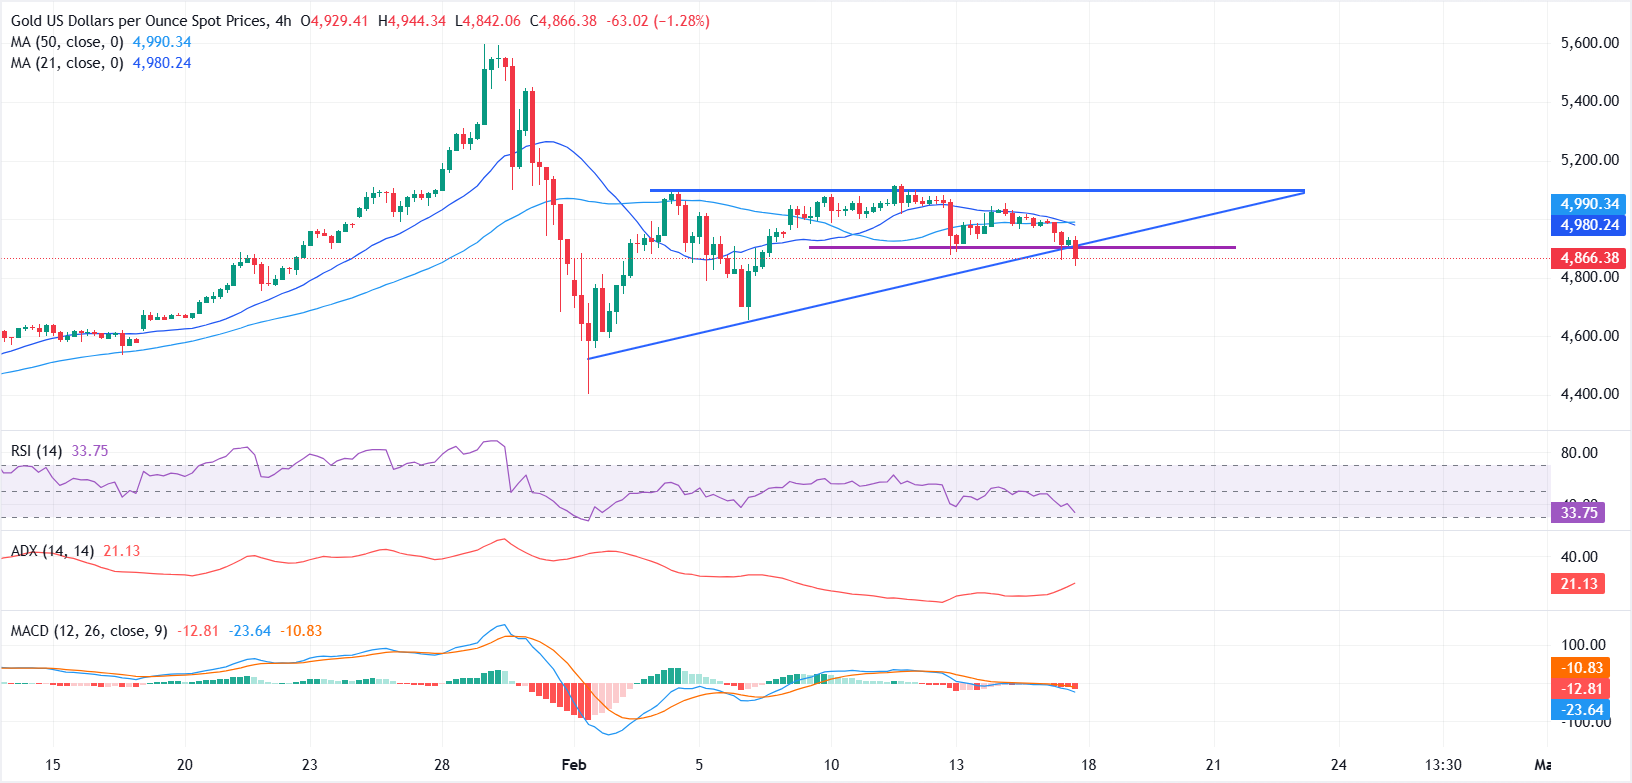
From a short-term technical perspective, indicators suggest XAU/USD remains in a consolidation phase with a slight negative bias. On the 4-hour chart, price has slipped below key moving averages and is currently hovering beneath the 100-period Simple Moving Average (SMA).
The rising trendline of a symmetrical triangle pattern near $4,900 is acting as immediate support. A decisive break below this level could intensify bearish pressure, exposing the next downside targets at $4,800, followed by $4,700.
On the upside, a recovery above the $5,000 psychological mark and the 100-period SMA around $5,021 would help ease immediate downside risks. However, a sustained move and strong close above the $5,050-$5,100 resistance zone would be required to attract fresh buying interest.
The Moving Average Convergence Divergence (MACD) shows a deepening negative histogram, with the MACD line positioned below the signal line and both holding below the zero level, indicating strengthening downside momentum.
Meanwhile, the Relative Strength Index (RSI) stands at 39, below the midline and comfortably above oversold territory, suggesting sellers remain in control while leaving room for further downside.
Gold FAQs
Gold has played a key role in human’s history as it has been widely used as a store of value and medium of exchange. Currently, apart from its shine and usage for jewelry, the precious metal is widely seen as a safe-haven asset, meaning that it is considered a good investment during turbulent times. Gold is also widely seen as a hedge against inflation and against depreciating currencies as it doesn’t rely on any specific issuer or government.
Central banks are the biggest Gold holders. In their aim to support their currencies in turbulent times, central banks tend to diversify their reserves and buy Gold to improve the perceived strength of the economy and the currency. High Gold reserves can be a source of trust for a country’s solvency. Central banks added 1,136 tonnes of Gold worth around $70 billion to their reserves in 2022, according to data from the World Gold Council. This is the highest yearly purchase since records began. Central banks from emerging economies such as China, India and Turkey are quickly increasing their Gold reserves.
Gold has an inverse correlation with the US Dollar and US Treasuries, which are both major reserve and safe-haven assets. When the Dollar depreciates, Gold tends to rise, enabling investors and central banks to diversify their assets in turbulent times. Gold is also inversely correlated with risk assets. A rally in the stock market tends to weaken Gold price, while sell-offs in riskier markets tend to favor the precious metal.
The price can move due to a wide range of factors. Geopolitical instability or fears of a deep recession can quickly make Gold price escalate due to its safe-haven status. As a yield-less asset, Gold tends to rise with lower interest rates, while higher cost of money usually weighs down on the yellow metal. Still, most moves depend on how the US Dollar (USD) behaves as the asset is priced in dollars (XAU/USD). A strong Dollar tends to keep the price of Gold controlled, whereas a weaker Dollar is likely to push Gold prices up.
Author

Vishal Chaturvedi
FXStreet
I am a macro-focused research analyst with over four years of experience covering forex and commodities market. I enjoy breaking down complex economic trends and turning them into clear, actionable insights that help traders stay ahead of the curve.