![]() Barry Weinstein
Barry Weinstein
Volatility Markets Newswire
Part 1) introduction
VolatilityMarkets suggests trend-inspired trades that capitalize on market trends.
In the short term Bed Bath and Beyond has been accelerating lower. In the long term Bed Bath and Beyond has been decelerating lower. With the short term trend being the stronger of the two, we propose a short trade idea with a one week time horizon.
Part 2) trade idea details
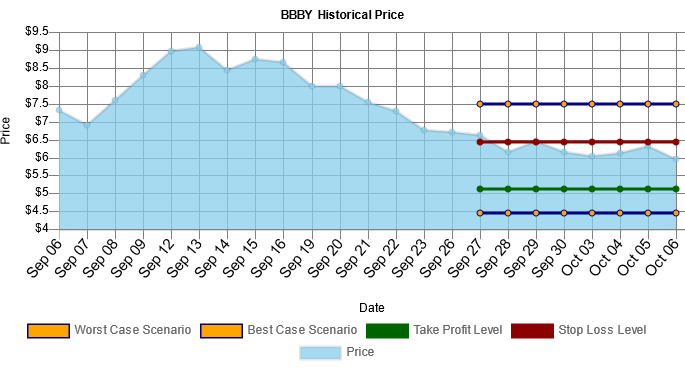
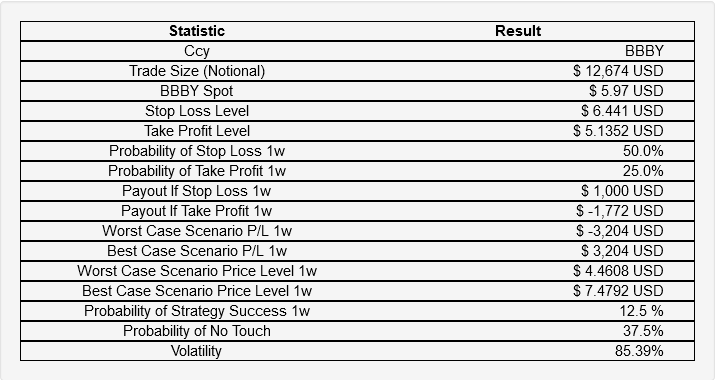
Sell $ 12,674 USD of Bed Bath and Beyond, take profit at $ 5.1352 level with 25.0% odds for a $ 1,772 USD gain, stop out at $ 6.441 with 50.0% odds for a $ 1,000 USD loss.
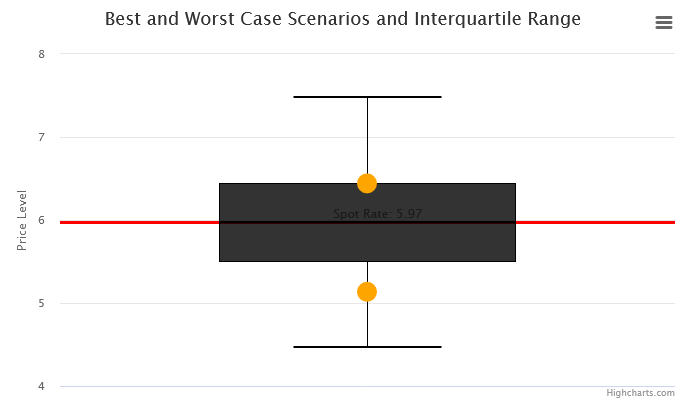
The BoxPlot below outlines the take profit and stop loss level placement of the trade idea, the inter-quartile range of expected traded outcomes, as well as the best and worst case scenario on the whiskers.
Scenario Analysis:
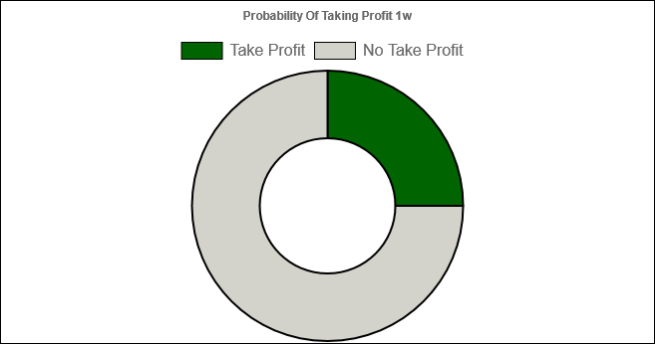
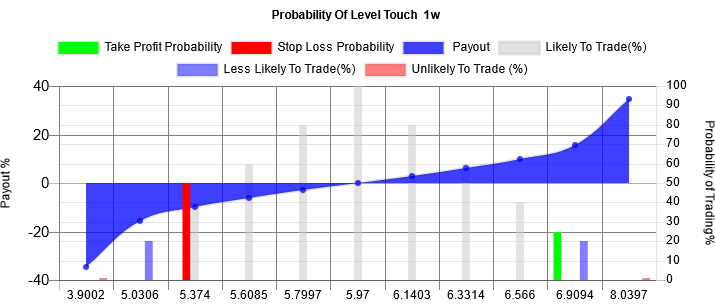
There is a 25.0% probability that the take profit level will independently trade over the 1w timeframe.
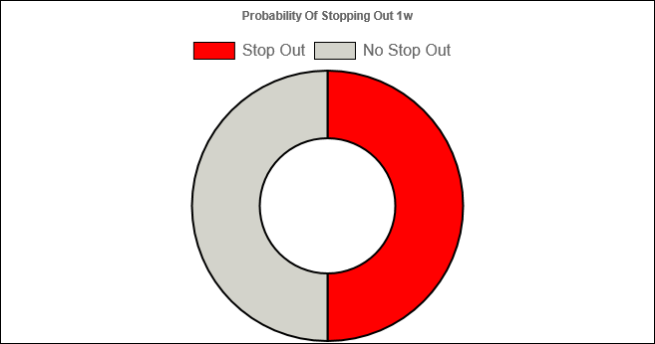
There is a 50.0% probability that the stop loss level will independently trade over the 1w timeframe.
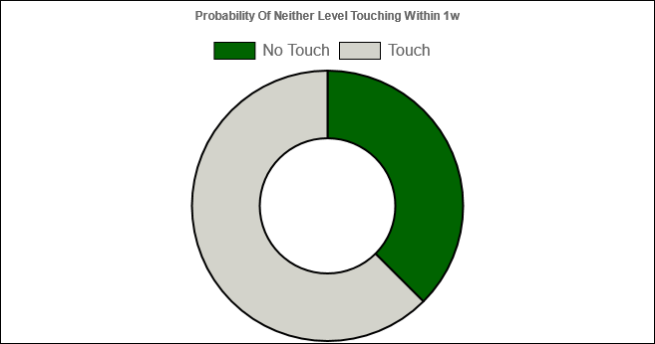
There is a 37.5% probability that neither the stop loss level nor take profit level will independently trade over the 1w timeframe.
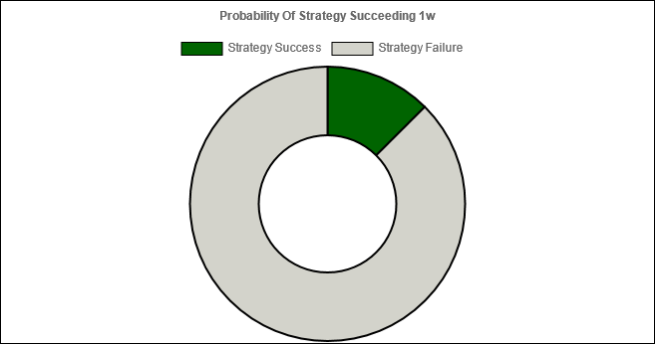
There is a 12.5% probability that the strategy succeeds by having the take profit level touch and the stop loss level not touch over the 1w timeframe.
Part 3) BBBY trend analysis
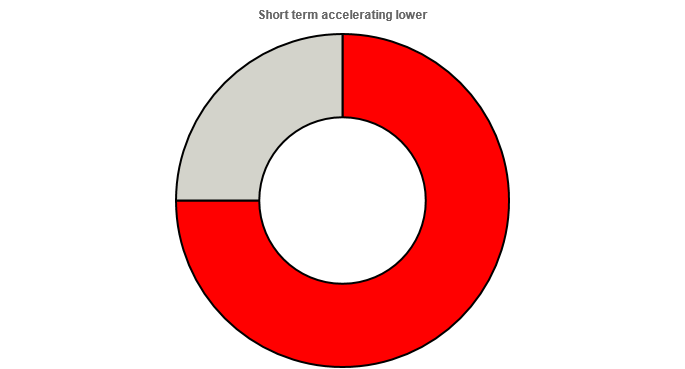
BBBY last price was $ 5.97. The short term trend accelerating lower is stronger than the long term trend decelerating lower. This trade goes short when the last change was lower and accelerating.
Price Summary
Today's last mid price was $ 5.97.
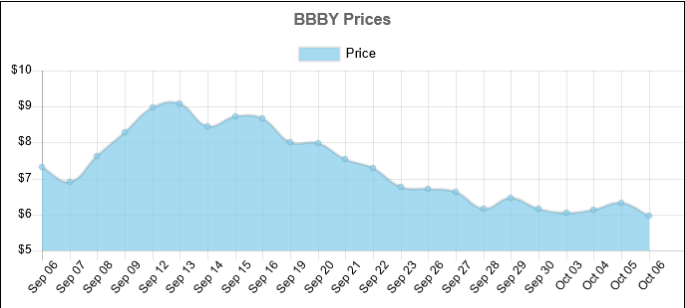
Price Changes
Over the past 22 Days, the price has decreased by -18.55% percent.
Long Term Trend Analysis:
This trade goes short when the price was moving lower and accelerating over the past 22 days.
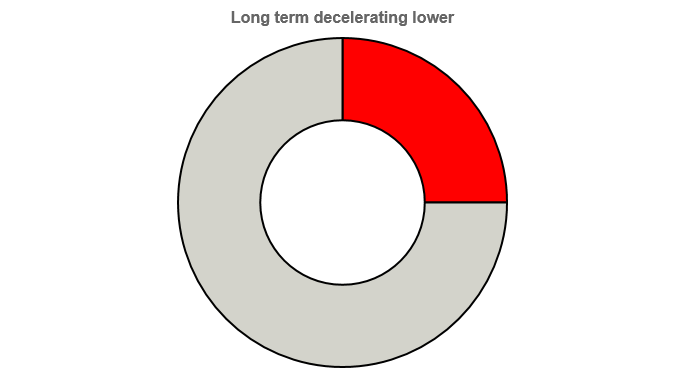
Over the past 22 days, the price has on average been decelerating $ -0.0036 per day.
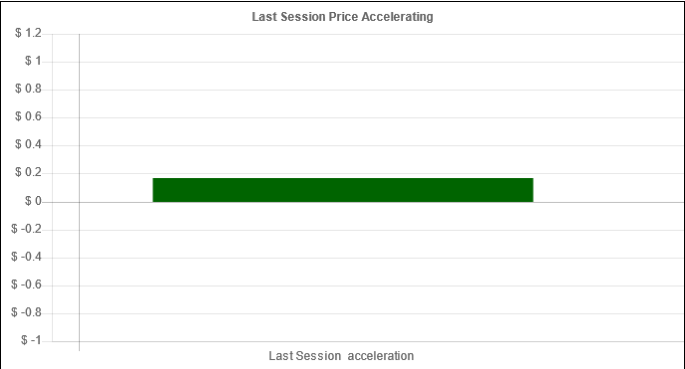
Short Term Trend Analysis:
This trade goes short when the last change was lower and accelerating.
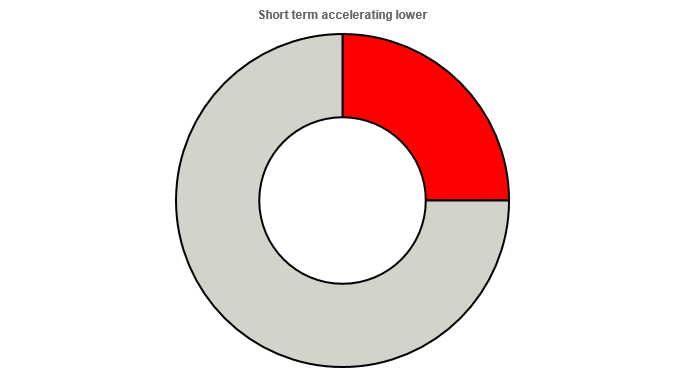
Over the last session, the price has accelerated $ 0.17.
Part 4) BBBY value analysis
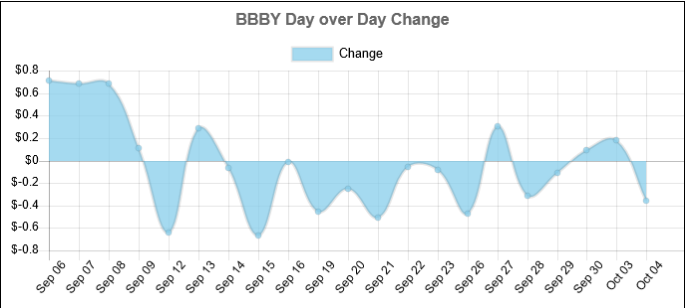
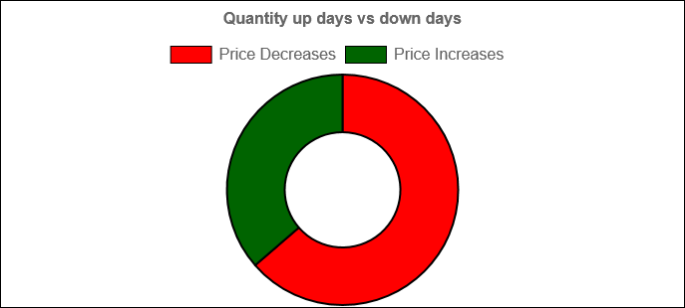
Over the past 22 days, the BBBY price increased 8 days and decreased 14 days. For every up day, there were 1.75 down days. The average return on days where the price increased is 5.2069% The average return on days where the price decreased is -4.2088% Over the past 22 Days, the price has decreased by -18.55% percent. Over the past 22 days, the average return per day has been -0.8432% percent.
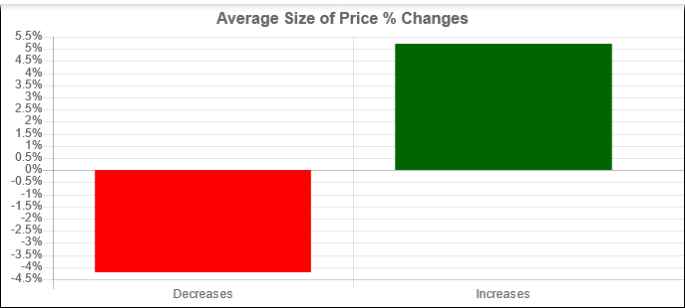
Market Skew
Over the past 22 days, the BBBY price increased 8 days and decreased 14 Days.
For every up day, there were 1.75 down days.
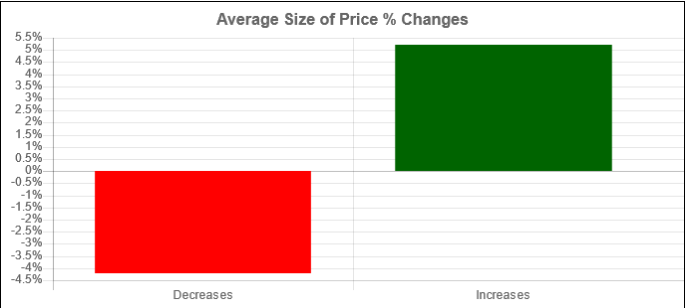
The average return on days where the price increased is 5.2069%.
The average return on days where the price decreased is -4.2088%.
Part 5) BBBY worst/best case scenario analysis
Within 1 week, our worst case scenario where we are 95% certain that this level won't trade for BBBY, is $ 4.4608 , and the best case scenario overnight is $ 7.4792 . levels outside of this range are unlikely, but still possible, to trade. We are 50% confident that $ 6.441 could trade and that $ 5.1352 could trade. These levels are within statistical probability.
Expected Range
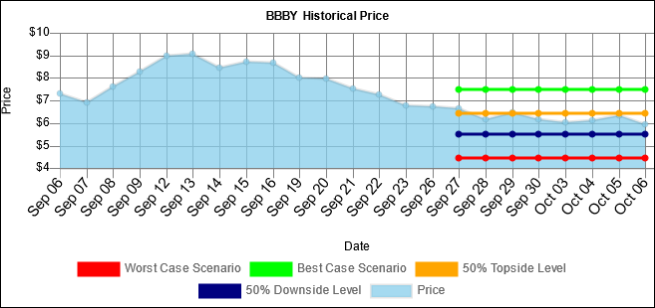
Within 1 week, our worst case scenario where we are 95% certain that this level won't trade for BBBY, is $ 4.4608 , and the best case scenario overnight is $ 7.4792 . levels outside of this range are unlikely, but still possible, to trade.
We are 50% confident that $ 6.441 could trade and that $ 5.1352 could trade. These levels are within statistical probability.
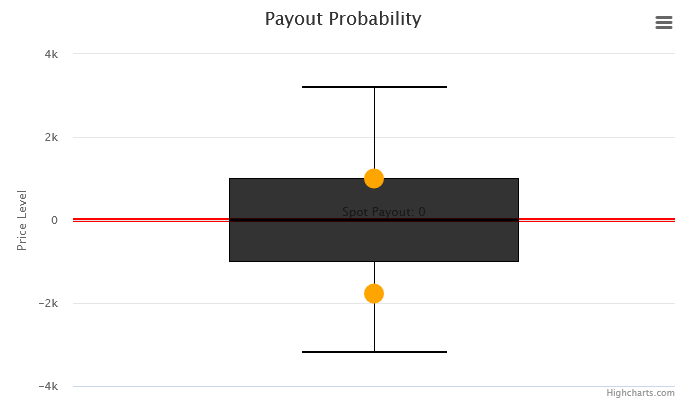
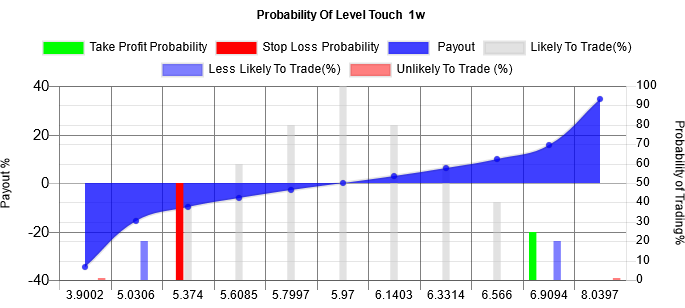
Probability Vs Payout Chart:
This graph contrasts the percentage payout of holding a position vs the probability that the payout occurs. The red and green columns represent the probability of stopping out and taking profit and their associated payouts.
Key Takeaways:
-
Price today $ 5.97.
-
Over the past 22 days, the BBBY price increased 8 days and decreased 14 Days.
-
For every up day, there were 1.75 down days.
-
The average return on days where the price increased is 5.2069%.
-
The average return on days where the price decreased is -4.2088%.
-
Over the past 22 Days, the price has decreased by -18.55% percent.
-
Over the past 22 days, the average return per day has been -0.8432% percent.
-
Over the past 22 days, The price has on average been decelerating: $ -0.0036 per day lower.
-
Over the last session, the price decreased by $ -0.355.
-
Over the last session, the price decreased by -5.9464 %.
-
Over the last session, the price accelerated by $ 0.17.
Volatility Markets provides trend following trade ideas for momentum traders. The Volatility Markets Newswire measures the direction and acceleration of a security and then structures a trade idea to capitalize on the trend. While trends have been shown to exist in markets over the past 100 years, they are no guarantee of future asset prices. You should take these ideas lightly and at your own risk.
Recommended content
Editors’ Picks
USD/JPY holds near 155.50 after Tokyo CPI inflation eases more than expected

USD/JPY is trading tightly just below the 156.00 handle, hugging multi-year highs as the Yen continues to deflate. The pair is trading into 30-plus year highs, and bullish momentum is targeting all-time record bids beyond 160.00, a price level the pair hasn’t reached since 1990.
AUD/USD stands firm above 0.6500 with markets bracing for Aussie PPI, US inflation

The Aussie Dollar begins Friday’s Asian session on the right foot against the Greenback after posting gains of 0.33% on Thursday. The AUD/USD advance was sponsored by a United States report showing the economy is growing below estimates while inflation picked up.
Gold soars as US economic woes and inflation fears grip investors

Gold prices advanced modestly during Thursday’s North American session, gaining more than 0.5% following the release of crucial economic data from the United States. GDP figures for the first quarter of 2024 missed estimates, increasing speculation that the US Fed could lower borrowing costs.
Stripe looks to bring back crypto payments as stablecoin market cap hits all-time high

Stripe announced on Thursday that it would add support for USDC stablecoin, as the stablecoin market exploded in March, according to reports by Cryptocompare.
Bank of Japan expected to keep interest rates on hold after landmark hike

The Bank of Japan is set to leave its short-term rate target unchanged in the range between 0% and 0.1% on Friday, following the conclusion of its two-day monetary policy review meeting for April. The BoJ will announce its decision on Friday at around 3:00 GMT.