Australian Dollar hovers above a major level ahead of RBA Governor Bullock's speech
- Australian Dollar continues to move downward on the firm US Dollar.
- Australia’s chief policymaker Michele Bullock will deliver a speech on Tuesday.
- China's CPI declined by 0.5% in November on both monthly and yearly basis.
- US NFP rose by 199,000 in November against the previous rise of 150,000.

The Australian Dollar (AUD) extends its losses for the second successive session on Monday. The robust employment figures in the United States (US) bolstered the Greenback on Friday, exerting downward pressure on the AUD/USD pair. Furthermore, worries about deflation in China, coupled with a Consumer Price Index (CPI) and Producer Price Index (PPI) that fell short of expectations, contributed to a selling spree on the Australian Dollar (AUD).
Australia’s chief policymaker Michele Bullock, the Governor of the Reserve Bank of Australia (RBA), is scheduled to deliver a speech on Tuesday. The RBA opted to maintain the cash rate at 4.35% at its December meeting. While the RBA maintains a tightening bias, recent economic indicators suggest a likelihood of no further rate hikes in the near future.
US Bureau of Labor Statistics (BLS) revealed on Friday that November's US Nonfarm Payrolls (NFP) exceeded market forecasts. Simultaneously, the Unemployment Rate saw a decline during the same period. Consequently, there has been an upward surge in US Treasury yields, supporting the strengthening of the USD.
The stronger employment data have ignited discussions and speculations about the forthcoming path of the US Federal Reserve's (Fed) monetary policy and the duration for which the central bank intends to uphold rates at restrictive levels. The attention will be on the US Consumer Price Index (CPI) on Tuesday and the Fed Interest Rate Decision on Wednesday.
Daily Digest Market Movers: Australian Dollar moves downward on a negative bias
- Australia's Trade Balance (MoM) data was released last week and showed a surplus of 7,129M against the expected figures of 7,500M in October.
- China's Consumer Price Index (CPI) experienced a year-on-year decline of 0.5% in November, compared to a 0.2% decrease in October. On a monthly basis, Chinese inflation fell by 0.5%, surpassing the 0.1% decline observed in October.
- China's Producer Price Index (PPI) recorded a 3.0% year-on-year drop in November, reflecting a more substantial decline than the 2.6% decrease reported in October.
- US Nonfarm Payrolls for November rose by 199,000 against the previous rise of 150,000 in October and the market expectation of 180,000.
- US Average Hourly Earnings (Year-on-Year) held steady at 4.0%, aligning with market projections for November. Meanwhile, the Unemployment Rate dropped to 3.7% from the previous 3.9%.
- The preliminary Michigan Consumer Sentiment Index for December reached 69.4, a notable increase from the previous reading of 61.3.
Technical Analysis: Australian Dollar looks to reach the major level at 0.6550
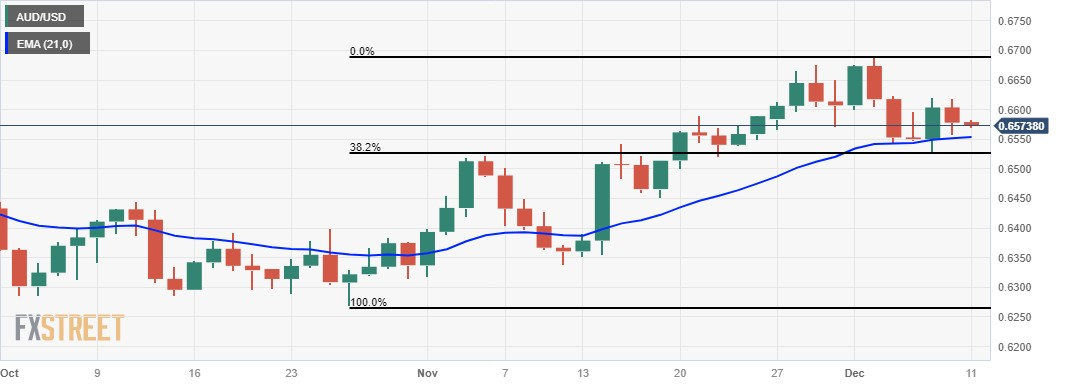
The Australian Dollar trades lower around 0.6560 on Monday. The 21-day Exponential Moving Average (EMA) at 0.6553 could act as a key support, which is lined up with the major level at 0.6550. A break below the support region could put weight on the AUD/USD pair to navigate the area around 38.2% Fibonacci retracement at 0.6526 level. On the upside, the psychological level at 0.6600 would likely serve as a potential barrier.
AUD/USD: Daily Chart
Australian Dollar price today
The table below shows the percentage change of Australian Dollar (AUD) against listed major currencies today. Australian Dollar was the weakest against the US Dollar.
| USD | EUR | GBP | CAD | AUD | JPY | NZD | CHF | |
| USD | 0.04% | 0.06% | 0.05% | 0.34% | 0.82% | 0.28% | 0.03% | |
| EUR | -0.05% | 0.02% | 0.00% | 0.30% | 0.77% | 0.23% | -0.02% | |
| GBP | -0.05% | -0.01% | -0.02% | 0.29% | 0.76% | 0.21% | -0.04% | |
| CAD | -0.04% | 0.00% | 0.01% | 0.29% | 0.77% | 0.23% | -0.02% | |
| AUD | -0.34% | -0.30% | -0.29% | -0.30% | 0.48% | -0.07% | -0.32% | |
| JPY | -0.84% | -0.80% | -0.86% | -0.80% | -0.48% | -0.57% | -0.82% | |
| NZD | -0.26% | -0.22% | -0.20% | -0.23% | 0.08% | 0.54% | -0.25% | |
| CHF | -0.03% | 0.02% | 0.03% | 0.02% | 0.31% | 0.79% | 0.25% |
The heat map shows percentage changes of major currencies against each other. The base currency is picked from the left column, while the quote currency is picked from the top row. For example, if you pick the Euro from the left column and move along the horizontal line to the Japanese Yen, the percentage change displayed in the box will represent EUR (base)/JPY (quote).
Australian Dollar FAQs
What key factors drive the Australian Dollar?
One of the most significant factors for the Australian Dollar (AUD) is the level of interest rates set by the Reserve Bank of Australia (RBA). Because Australia is a resource-rich country another key driver is the price of its biggest export, Iron Ore. The health of the Chinese economy, its largest trading partner, is a factor, as well as inflation in Australia, its growth rate and Trade Balance. Market sentiment – whether investors are taking on more risky assets (risk-on) or seeking safe-havens (risk-off) – is also a factor, with risk-on positive for AUD.
How do the decisions of the Reserve Bank of Australia impact the Australian Dollar?
The Reserve Bank of Australia (RBA) influences the Australian Dollar (AUD) by setting the level of interest rates that Australian banks can lend to each other. This influences the level of interest rates in the economy as a whole. The main goal of the RBA is to maintain a stable inflation rate of 2-3% by adjusting interest rates up or down. Relatively high interest rates compared to other major central banks support the AUD, and the opposite for relatively low. The RBA can also use quantitative easing and tightening to influence credit conditions, with the former AUD-negative and the latter AUD-positive.
How does the health of the Chinese Economy impact the Australian Dollar?
China is Australia’s largest trading partner so the health of the Chinese economy is a major influence on the value of the Australian Dollar (AUD). When the Chinese economy is doing well it purchases more raw materials, goods and services from Australia, lifting demand for the AUD, and pushing up its value. The opposite is the case when the Chinese economy is not growing as fast as expected. Positive or negative surprises in Chinese growth data, therefore, often have a direct impact on the Australian Dollar and its pairs.
How does the price of Iron Ore impact the Australian Dollar?
Iron Ore is Australia’s largest export, accounting for $118 billion a year according to data from 2021, with China as its primary destination. The price of Iron Ore, therefore, can be a driver of the Australian Dollar. Generally, if the price of Iron Ore rises, AUD also goes up, as aggregate demand for the currency increases. The opposite is the case if the price of Iron Ore falls. Higher Iron Ore prices also tend to result in a greater likelihood of a positive Trade Balance for Australia, which is also positive of the AUD.
How does the Trade Balance impact the Australian Dollar?
The Trade Balance, which is the difference between what a country earns from its exports versus what it pays for its imports, is another factor that can influence the value of the Australian Dollar. If Australia produces highly sought after exports, then its currency will gain in value purely from the surplus demand created from foreign buyers seeking to purchase its exports versus what it spends to purchase imports. Therefore, a positive net Trade Balance strengthens the AUD, with the opposite effect if the Trade Balance is negative.
Author

Akhtar Faruqui
FXStreet
Akhtar Faruqui is a Forex Analyst based in New Delhi, India. With a keen eye for market trends and a passion for dissecting complex financial dynamics, he is dedicated to delivering accurate and insightful Forex news and analysis.

















