|

AUD/USD technical analysis: Aussie climbing to two-day highs above the 0.6900 figure post US data

  • The US Durable Goods Orders came in worse-than-expected at -2.5% in April vs. -2% expected by anaysts. The news adds weight to the greenback weakness.
  • AUD/USD is showing some strength in the last two days but can bulls sustain the counter-trend move at least to the 0.6960 resistance?
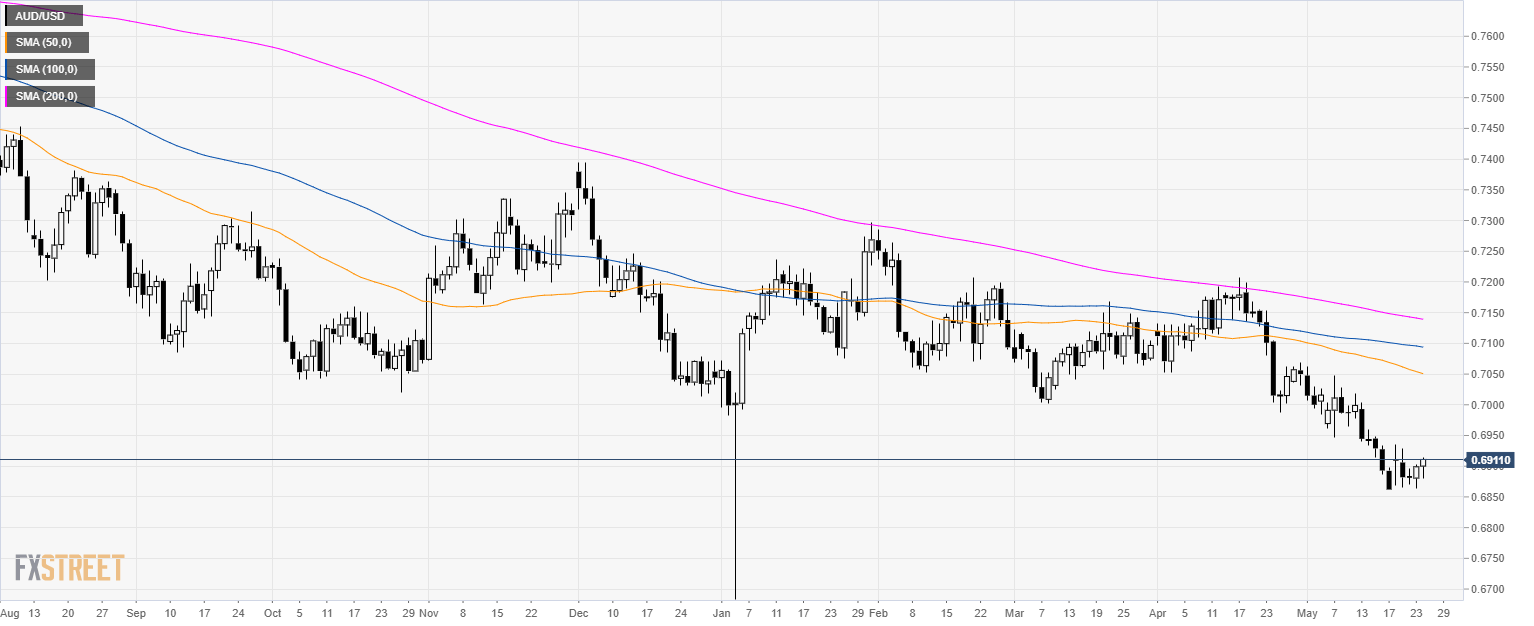
AUD/USD daily chart

AUD/USD is trading in a bear trend below its main simple moving averages (SMAs). The Aussie is consolidating its losses at multi-month lows.

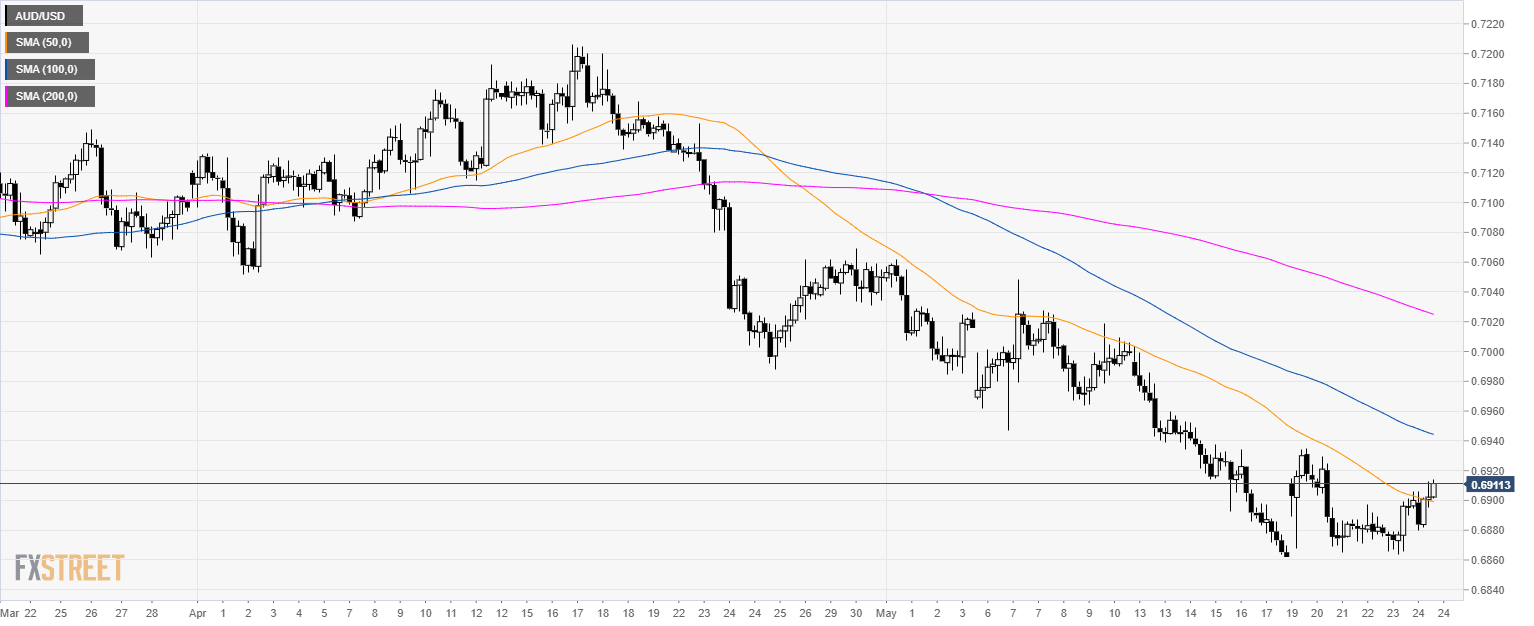
AUD/USD 4-hour chart

The current USD weakness is giving AUD/USD a boost while bulls are breaking above 0.6900 and and the 50 SMA. 


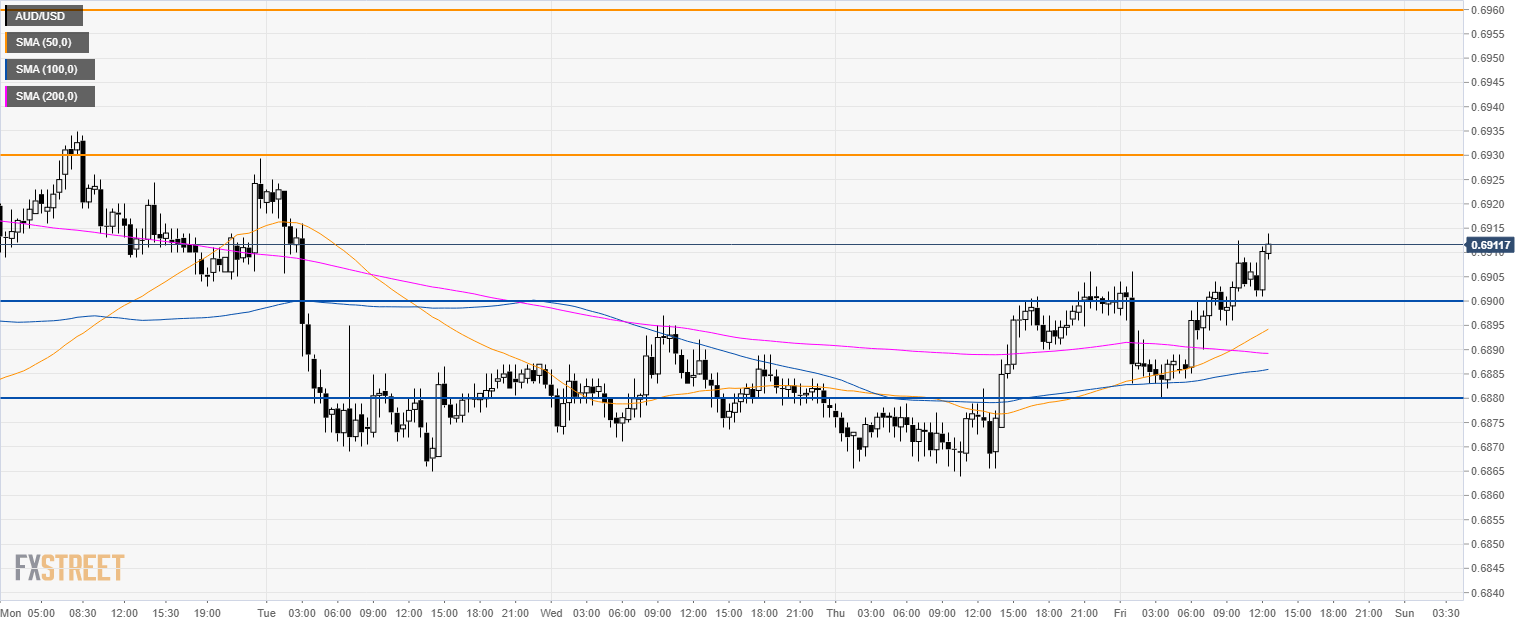
AUD/USD 30-minute chart


The Aussie is trading above the 0.6900 level and its main SMAs. Bulls can try to reach 0.6930 and 0.6960 resistances. Support is at the 0.6900 figure 0.6880 level.


Additional key levels

AUD/USD

Overview
Today last price0.6909
Today Daily Change0.0010
Today Daily Change %0.14
Today daily open0.6899
 
Trends
Daily SMA200.6965
Daily SMA500.7054
Daily SMA1000.7096
Daily SMA2000.7141
Levels
Previous Daily High0.6902
Previous Daily Low0.6864
Previous Weekly High0.7003
Previous Weekly Low0.6862
Previous Monthly High0.7206
Previous Monthly Low0.6988
Daily Fibonacci 38.2%0.6887
Daily Fibonacci 61.8%0.6879
Daily Pivot Point S10.6875
Daily Pivot Point S20.685
Daily Pivot Point S30.6837
Daily Pivot Point R10.6913
Daily Pivot Point R20.6926
Daily Pivot Point R30.6951

Author

Flavio Tosti

Flavio Tosti

Independent Analyst


More from Flavio Tosti
Share:

Editor's Picks

EUR/USD looks sidelined around 1.1850

EUR/USD remains on the back foot, extending its bearish tone and sliding towards the 1.1850 area to print fresh daily lows on Monday. The move lower comes as the US Dollar gathers modest traction, with thin liquidity and subdued volatility amplifying price swings amid the US market holiday.

GBP/USD flirts with daily lows near 1.3630

GBP/USD has quickly given back Friday’s solid gains, turning lower at the start of the week and drifting back towards the 1.3630 area. The focus now shifts squarely to Tuesday’s UK labour market report, which is likely to keep the quid firmly in the spotlight and could set the tone for Cable’s next move.

Gold loses momentum, eases below $5,000

Gold is giving back part of Friday’s sharp rebound, deflating below the key $5,000 mark per troy ounce as the new week gets underway. Modest gains in the US Dollar are keeping the metal in check, while thin trading conditions, due to the Presidents Day holiday in the US, are adding to the choppy and hesitant tone across markets.

Bitcoin consolidates as on-chain data show mixed signals

Bitcoin price has consolidated between $65,700 and $72,000 over the past nine days, with no clear directional bias. US-listed spot ETFs recorded a $359.91 million weekly outflow, marking the fourth consecutive week of withdrawals.

The week ahead: Key inflation readings and why the AI trade could be overdone

It is likely to be a quiet start to the week, with US markets closed on Monday for Presidents Day. European markets are higher across the board and gold is clinging to the $5,000 level after the tamer than expected CPI report in the US reduced haven flows to precious metals.

XRP steadies in narrow range as fund inflows, futures interest rise

Ripple is trading in a narrow range between $1.45 (immediate support) and $1.50 (resistance) at the time of writing on Monday. The remittance token extended its recovery last week, peaking at $1.67 on Sunday from the weekly open at $1.43.