AUD/USD stabilizes under 0.7100, ends week down more than 150 pips


  • Australian dollar among worst performers over the week, hit by RBA expectations.
  • AUD/USD unable to recover ground heads for the lowest close since September 28.

The AUD/USD pair traded sideways on Friday, consolidating a weekly loss of more than 150 pips. The US dollar weakened amid an improvement in risk sentiment, but still the aussie was unable to stage a recovery.

The Australian dollar was the worst performer among G10 currencies during the week. “The AUD has been undermined over the past week by building expectations for further RBA easing next month, and the broad-based deterioration in risk sentiment”, explained analysts at MUFG Bank. They point out the aussie remains one of the most sensitive G10 currencies to equity market performance.

At MUFG Bank, analysts see limited downside considering an improving economic performance from China. They also noted the aussie could “from expectations over a Blue Wave at the US election. It would open the door to more significant US fiscal stimulus providing support for global growth, and a likely easing of US-China trade tensions.”

Technical outlook

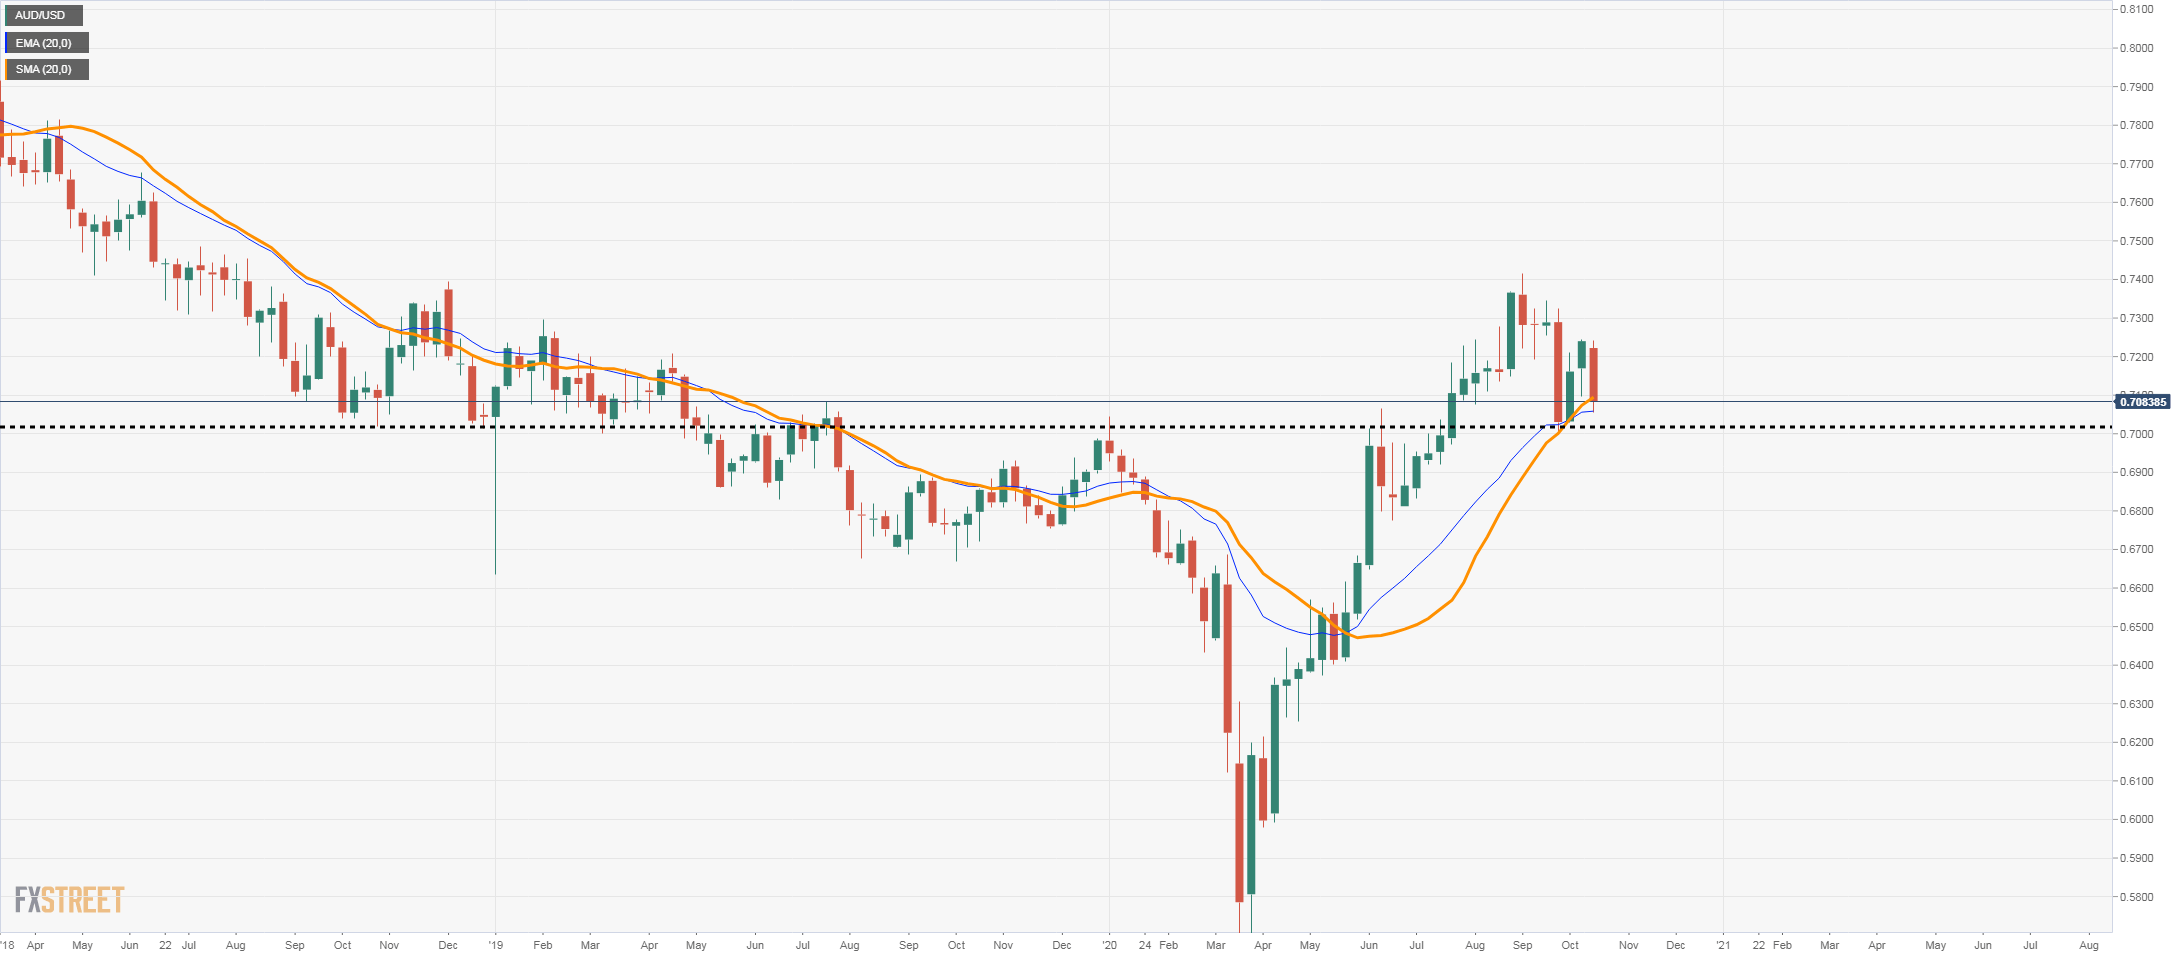
The weekly chart shows the AUD/USD standing above the 20-week moving average, with a current patter of slow moves to the upside and sharp declines. The bias points to the downside with a key support at the 20-week moving average around 0.7070 and then, the 0.7000 area; a break lower should increase the bearish pressure.

It AUD/USD manages to hold above 0.7100 over the next week, the aussie could alleviate the pressure, but it needs to break above 0.7220/40 to negate the current negative bias.

AUD/USD weekly chart


audusd

AUD/USD

Overview
Today last price 0.7085
Today Daily Change -0.0008
Today Daily Change % -0.11
Today daily open 0.7093
 
Trends
Daily SMA20 0.715
Daily SMA50 0.7206
Daily SMA100 0.7093
Daily SMA200 0.6789
 
Levels
Previous Daily High 0.7172
Previous Daily Low 0.7055
Previous Weekly High 0.7244
Previous Weekly Low 0.7096
Previous Monthly High 0.7414
Previous Monthly Low 0.7004
Daily Fibonacci 38.2% 0.71
Daily Fibonacci 61.8% 0.7127
Daily Pivot Point S1 0.7041
Daily Pivot Point S2 0.699
Daily Pivot Point S3 0.6924
Daily Pivot Point R1 0.7158
Daily Pivot Point R2 0.7224
Daily Pivot Point R3 0.7275


Share: Feed news

Information on these pages contains forward-looking statements that involve risks and uncertainties. Markets and instruments profiled on this page are for informational purposes only and should not in any way come across as a recommendation to buy or sell in these assets. You should do your own thorough research before making any investment decisions. FXStreet does not in any way guarantee that this information is free from mistakes, errors, or material misstatements. It also does not guarantee that this information is of a timely nature. Investing in Open Markets involves a great deal of risk, including the loss of all or a portion of your investment, as well as emotional distress. All risks, losses and costs associated with investing, including total loss of principal, are your responsibility. The views and opinions expressed in this article are those of the authors and do not necessarily reflect the official policy or position of FXStreet nor its advertisers. The author will not be held responsible for information that is found at the end of links posted on this page.

If not otherwise explicitly mentioned in the body of the article, at the time of writing, the author has no position in any stock mentioned in this article and no business relationship with any company mentioned. The author has not received compensation for writing this article, other than from FXStreet.

FXStreet and the author do not provide personalized recommendations. The author makes no representations as to the accuracy, completeness, or suitability of this information. FXStreet and the author will not be liable for any errors, omissions or any losses, injuries or damages arising from this information and its display or use. Errors and omissions excepted.

The author and FXStreet are not registered investment advisors and nothing in this article is intended to be investment advice.

Recommended content


Recommended content

Editors’ Picks

EUR/USD alternates gains with losses near 1.0720 post-US PCE

EUR/USD alternates gains with losses near 1.0720 post-US PCE

The bullish tone in the Greenback motivates EUR/USD to maintain its daily range in the low 1.070s in the wake of firmer-than-estimated US inflation data measured by the PCE.

EUR/USD News

GBP/USD clings to gains just above 1.2500 on US PCE

GBP/USD clings to gains just above 1.2500 on US PCE

GBP/USD keeps its uptrend unchanged and navigates the area beyond 1.2500 the figure amidst slight gains in the US Dollar following the release of US inflation tracked by the PCE.

GBP/USD News

Gold keeps its daily gains near $2,350 following US inflation

Gold keeps its daily gains near $2,350 following US inflation

Gold prices maintain their constructive bias around $2,350 after US inflation data gauged by the PCE surpassed consensus in March and US yields trade with slight losses following recent peaks.

Gold News

Bitcoin Weekly Forecast: BTC’s next breakout could propel it to $80,000 Premium

Bitcoin Weekly Forecast: BTC’s next breakout could propel it to $80,000

Bitcoin’s recent price consolidation could be nearing its end as technical indicators and on-chain metrics suggest a potential upward breakout. However, this move would not be straightforward and could punish impatient investors. 

Read more

Week ahead – Hawkish risk as Fed and NFP on tap, Eurozone data eyed too

Week ahead – Hawkish risk as Fed and NFP on tap, Eurozone data eyed too

Fed meets on Wednesday as US inflation stays elevated. Will Friday’s jobs report bring relief or more angst for the markets? Eurozone flash GDP and CPI numbers in focus for the Euro.

Read more

Forex MAJORS

Cryptocurrencies

Signatures