|

AUD/USD Price Analysis: Rising wedge confirmation teases bears below 0.6680 previous support

  • AUD/USD licks its wounds after posting weekly loss, as well as confirming bearish chart formation.
  • Downbeat oscillators, key SMAs also challenge Aussie pair buyers.
  • Monthly low can act as intermediate halt during theoretical target surrounding October 2022 peak.

AUD/USD buyers struggle to keep the reins around 0.6650 during Monday’s sluggish trading session, after a volatile week. In doing so, the Aussie pair licks its wounds after posting the weekly loss but lacks recovery momentum to extend the late Friday’s corrective bounce off a one-week low.

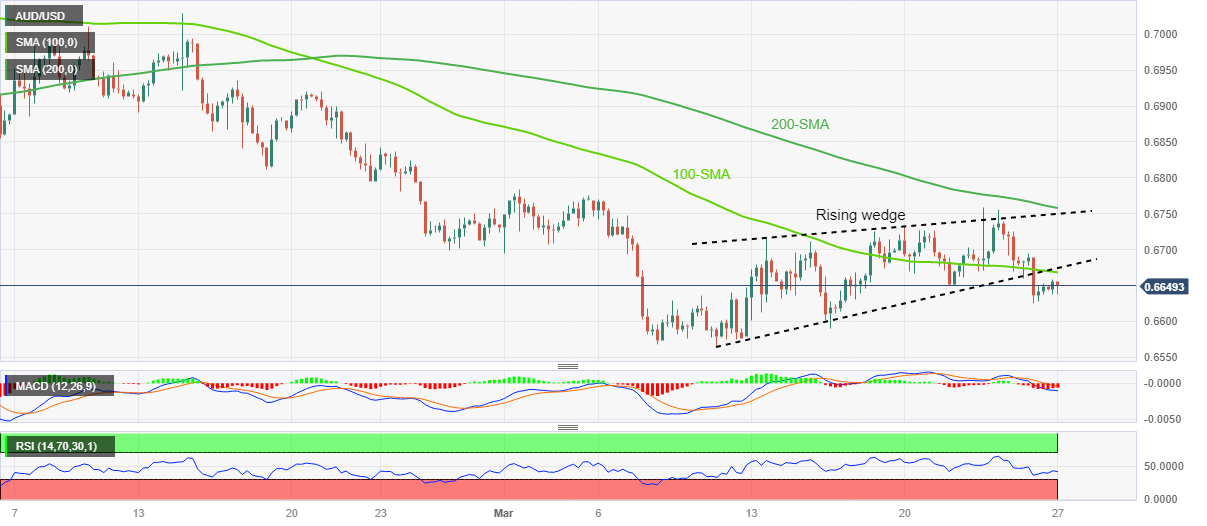
It should be noted that the AUD/USD pair’s confirmation of a two-week-old rising wedge bearish chart formations joins the bearish MACD signals and downbeat RSI (14), not oversold, to keep sellers hopeful.

That said, the latest trough surrounding 0.6625 lures intraday sellers of the Aussie pair before highlighting the monthly low of 0.6564.

Following that, the theoretical target of rising wedge confirmation, surrounding 0.6650, joins the October 2022 peak of near 0.6645, to offer strong support to the sellers.

On the flip side, the 100-bar Simple Moving Average (SMA), near 0.6670 at the latest, guards immediate recovery moves of the AUD/USD pair before the stated wedge’s lower line, around 0.6680.

Even if the Aussie pair crosses the 0.6680 support-turned-resistance, the wedge’s top line and the 200-SMA, respectively near 0.6750 and 0.6760, could challenge the bulls.

It’s worth observing that the monthly high of around 0.6785 acts as the last defense of the AUD/USD bears.

AUD/USD: Four-hour chart

Trend: Further downside expected

Additional important levels

Overview
Today last price0.6645
Today Daily Change0.0001
Today Daily Change %0.02%
Today daily open0.6644
 
Trends
Daily SMA200.6676
Daily SMA500.6846
Daily SMA1000.6793
Daily SMA2000.6758
 
Levels
Previous Daily High0.6694
Previous Daily Low0.6625
Previous Weekly High0.6759
Previous Weekly Low0.6625
Previous Monthly High0.7158
Previous Monthly Low0.6698
Daily Fibonacci 38.2%0.6652
Daily Fibonacci 61.8%0.6668
Daily Pivot Point S10.6615
Daily Pivot Point S20.6585
Daily Pivot Point S30.6546
Daily Pivot Point R10.6684
Daily Pivot Point R20.6724
Daily Pivot Point R30.6753

Author

Anil Panchal

Anil Panchal

FXStreet

Anil Panchal has nearly 15 years of experience in tracking financial markets. With a keen interest in macroeconomics, Anil aptly tracks global news/updates and stays well-informed about the global financial moves and their implications.

More from Anil Panchal
Share:

Markets move fast. We move first.

Orange Juice Newsletter brings you expert driven insights - not headlines. Every day on your inbox.

By subscribing you agree to our Terms and conditions.

Editor's Picks

EUR/USD eases toward 1.1700 as USD finds fresh demand

EUR/USD eases toward the 1.1700 mark in Europe trading on Friday. The pair faces headwinds from a renewed uptick in the US Dollar as investors look past softer US inflation data. However, the EUR/USD downside appears capped by expectations of the Fed-ECB monetary policy divergence. 

GBP/USD steadies below 1.3400 as traders digest BoE policy update and US inflation data

The GBP/USD pair stalls the previous day's pullback from the vicinity of mid-1.3400s and a nearly two-month high, though it struggles to attract meaningful buyers during the Asian session on Friday. Spot prices currently trade around the 1.3380-1.3385 region, up only 0.05% for the day, amid mixed cues.

Gold stays weak below $4,350 as USD bulls shrug off softer US CPI

Gold holds the previous day's late pullback from the vicinity of the record high and stays in the red below $4,350 in the European session on Friday. The US CPI report released on Thursday pointed to cooling inflationary pressures, but the US Dollar seems resilient amid a fresh bout of short-covering.

Bitcoin, Ethereum and Ripple correction slide as BoJ rate decision weighs on sentiment

Bitcoin, Ethereum, and Ripple are extending their correction phases after losing nearly 3%, 8%, and 10%, respectively, through Friday. The pullback phase is further strengthened as the upcoming Bank of Japan’s rate decision on Friday weighs on risk sentiment, with BTC breaking key support, ETH deepening weekly losses, and XRP sliding to multi-month lows.

How much can one month of soft inflation change the Fed’s mind?

One month of softer inflation data is rarely enough to shift Federal Reserve policy on its own, but in a market highly sensitive to every data point, even a single reading can reshape expectations. November’s inflation report offered a welcome sign of cooling price pressures. 

Ethereum Price Forecast: EF outlines ways to solve growing state issues

Ethereum price today: $2,920. The EF noted that Ethereum's growing state could lead to centralization and weaken censorship resistance. The Stateless Consensus team outlined state expiry, state archive and partial statelessness as potential solutions to the growing state load.