|

AUD/USD Price Analysis: Retreats from daily tops around 0.7390s towards 0.7330s

  • After the US CPI report, the AUD/USD seesawed around the 0.7320-0.7392 range during the day.
  • US CPI increased the most since 1990, topping 6.2%.
  • AUD/USD Technical outlook: DMA’s above the spot price and the RSI indicate a downward bias in the near term.

The Australian dollar slides during the New York session, down 0.64%, trading at 0.7334 at the time of writing. Earlier in the Asian Pacific session, the pair edged slightly lower, around the 0.7350 area, in choppy trading conditions, sideways. When  US inflation figures crossed the wires, the AUD/USD fluctuated around the 0.7339-92 range.

US CPI increased the most since 1990, topping 6.2%

The Labour Department reported on Wednesday that the US Consumer Price Index (CPI) for October increased by 6.2%, on annual base numbers, higher than the 5.3% foreseen by analysts. Additionally, unveiled that the Core CPI that excludes energy and food volatile items increased by 4.6% for the same period, more than the 4.3% estimated by economists. 

According to the report, prices in energy, shelter, food, and vehicles triggered the spike in the CPI. Also, inflation is broadening beyond areas associated with a reopening.

AUD/USD Price Forecast: Technical outlook

Daily chart

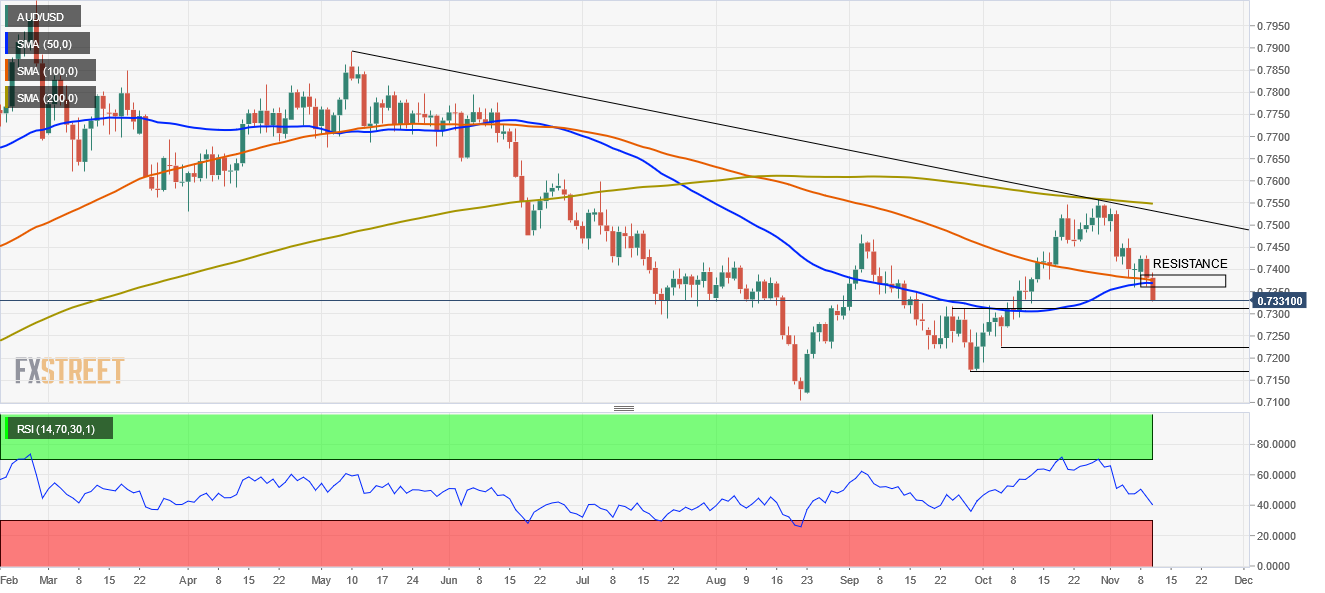
At press time, after the flurry of US CPI, the AUD/USD settled around the 0.7330 area. The daily moving averages (DMA’s) reside above the spot price, confirming in the near-term a downward bias, acting as resistance levels.

Also, the Relative Strength Index (RSI) at 39, below the 50-central line and with enough room before reaching oversold levels, adds another signal to the bearish bias. 
To accelerate the downtrend, AUD/USD sellers will need a break below the September 24 high at 0.7316. In that outcome, the pair could travel south towards the October 6 low at 0.7225.

AUD/USD

Overview
Today last price0.7334
Today Daily Change-0.0047
Today Daily Change %-0.64
Today daily open0.7381
 
Trends
Daily SMA200.7456
Daily SMA500.737
Daily SMA1000.7378
Daily SMA2000.755
 
Levels
Previous Daily High0.7432
Previous Daily Low0.736
Previous Weekly High0.7537
Previous Weekly Low0.736
Previous Monthly High0.7557
Previous Monthly Low0.7191
Daily Fibonacci 38.2%0.7388
Daily Fibonacci 61.8%0.7405
Daily Pivot Point S10.735
Daily Pivot Point S20.732
Daily Pivot Point S30.7279
Daily Pivot Point R10.7422
Daily Pivot Point R20.7463
Daily Pivot Point R30.7493

Author

Christian Borjon Valencia

Markets analyst, news editor, and trading instructor with over 14 years of experience across FX, commodities, US equity indices, and global macro markets.

More from Christian Borjon Valencia
Share:

Editor's Picks

EUR/USD looks to regain the 200-day SMA

EUR/USD regains some balance and trade just above 1.1600 the figure ahead of the opening bell in Asia. The pair initially dipped to the 1.1530 zone for the first time since November, always following the stronger US Dollar and the marked flight-to-safety in the context of the ongoing Middle East crisis
 

GBP/USD attacks 1.3300, refreshing three-month lows

GBP/USD is deep in the red near 1.3300, accelerating its downside to renew three-month lows in European trading on Tuesday. The ongoing escalation in the Iran war, combined with rising Oil prices, weighs negatively on the higher-yielding Pound Sterling as the US Dollar capitalizes on increased haven demand.

Gold bounces off lows, back above $5,100

Gold remains on the defensive, eroding part of the recent multi-day advance and managing to trade back above the $5,100 mark per troy ounce on Tuesday. The precious metal initially dropped just below the critical $5,000 threshold on the back of the persistent strength of the Greenback, higher US Treasury yields across the curve and investors' repricing of Fed rate cuts.

XRP risks extending losses as US-Iran war rages on

Ripple (XRP) has come under pressure, drifting lower to $1.35 at the time of writing on Tuesday. The over 2% correction looks poised to erase the previous day’s gains, which lifted the remittance token to $1.42.

Energy shock 2.0: Why rising Gas prices could hit the Euro

Even without a confirmed, sustained disruption, the mere risk to a key global energy chokepoint is enough to inject a significant premium into European Gas markets. And for the Euro, that matters.

Ripple falters amid sell-off jitters and negative funding rates

Ripple (XRP) has come under pressure, drifting lower to $1.35 at the time of writing on Tuesday. The over 2% correction looks poised to erase the previous day’s gains, which lifted the remittance token to $1.42.