|

AUD/USD Price Analysis: Pulling back within a short-term uptrend

  • AUD/USD is correcting back within a short-term uptrend. 
  • It will probably eventually find support and resume its bullish bias. 
  • The pair may have formed a Measured Move with a target for ending wave at 0.6680.

AUD/USD is trading in the 0.6590s on Tuesday as it continues correcting back from its May 3 high above 0.6600. 

The pull back is probably only a temporary correction. The rising sequence of peaks and troughs on the 4-hour chart suggest the pair is in a short-term uptrend, which given the old adage that “the trend is your friend”, is biased to eventually continue higher. 

AUD/USD 4-hour Chart

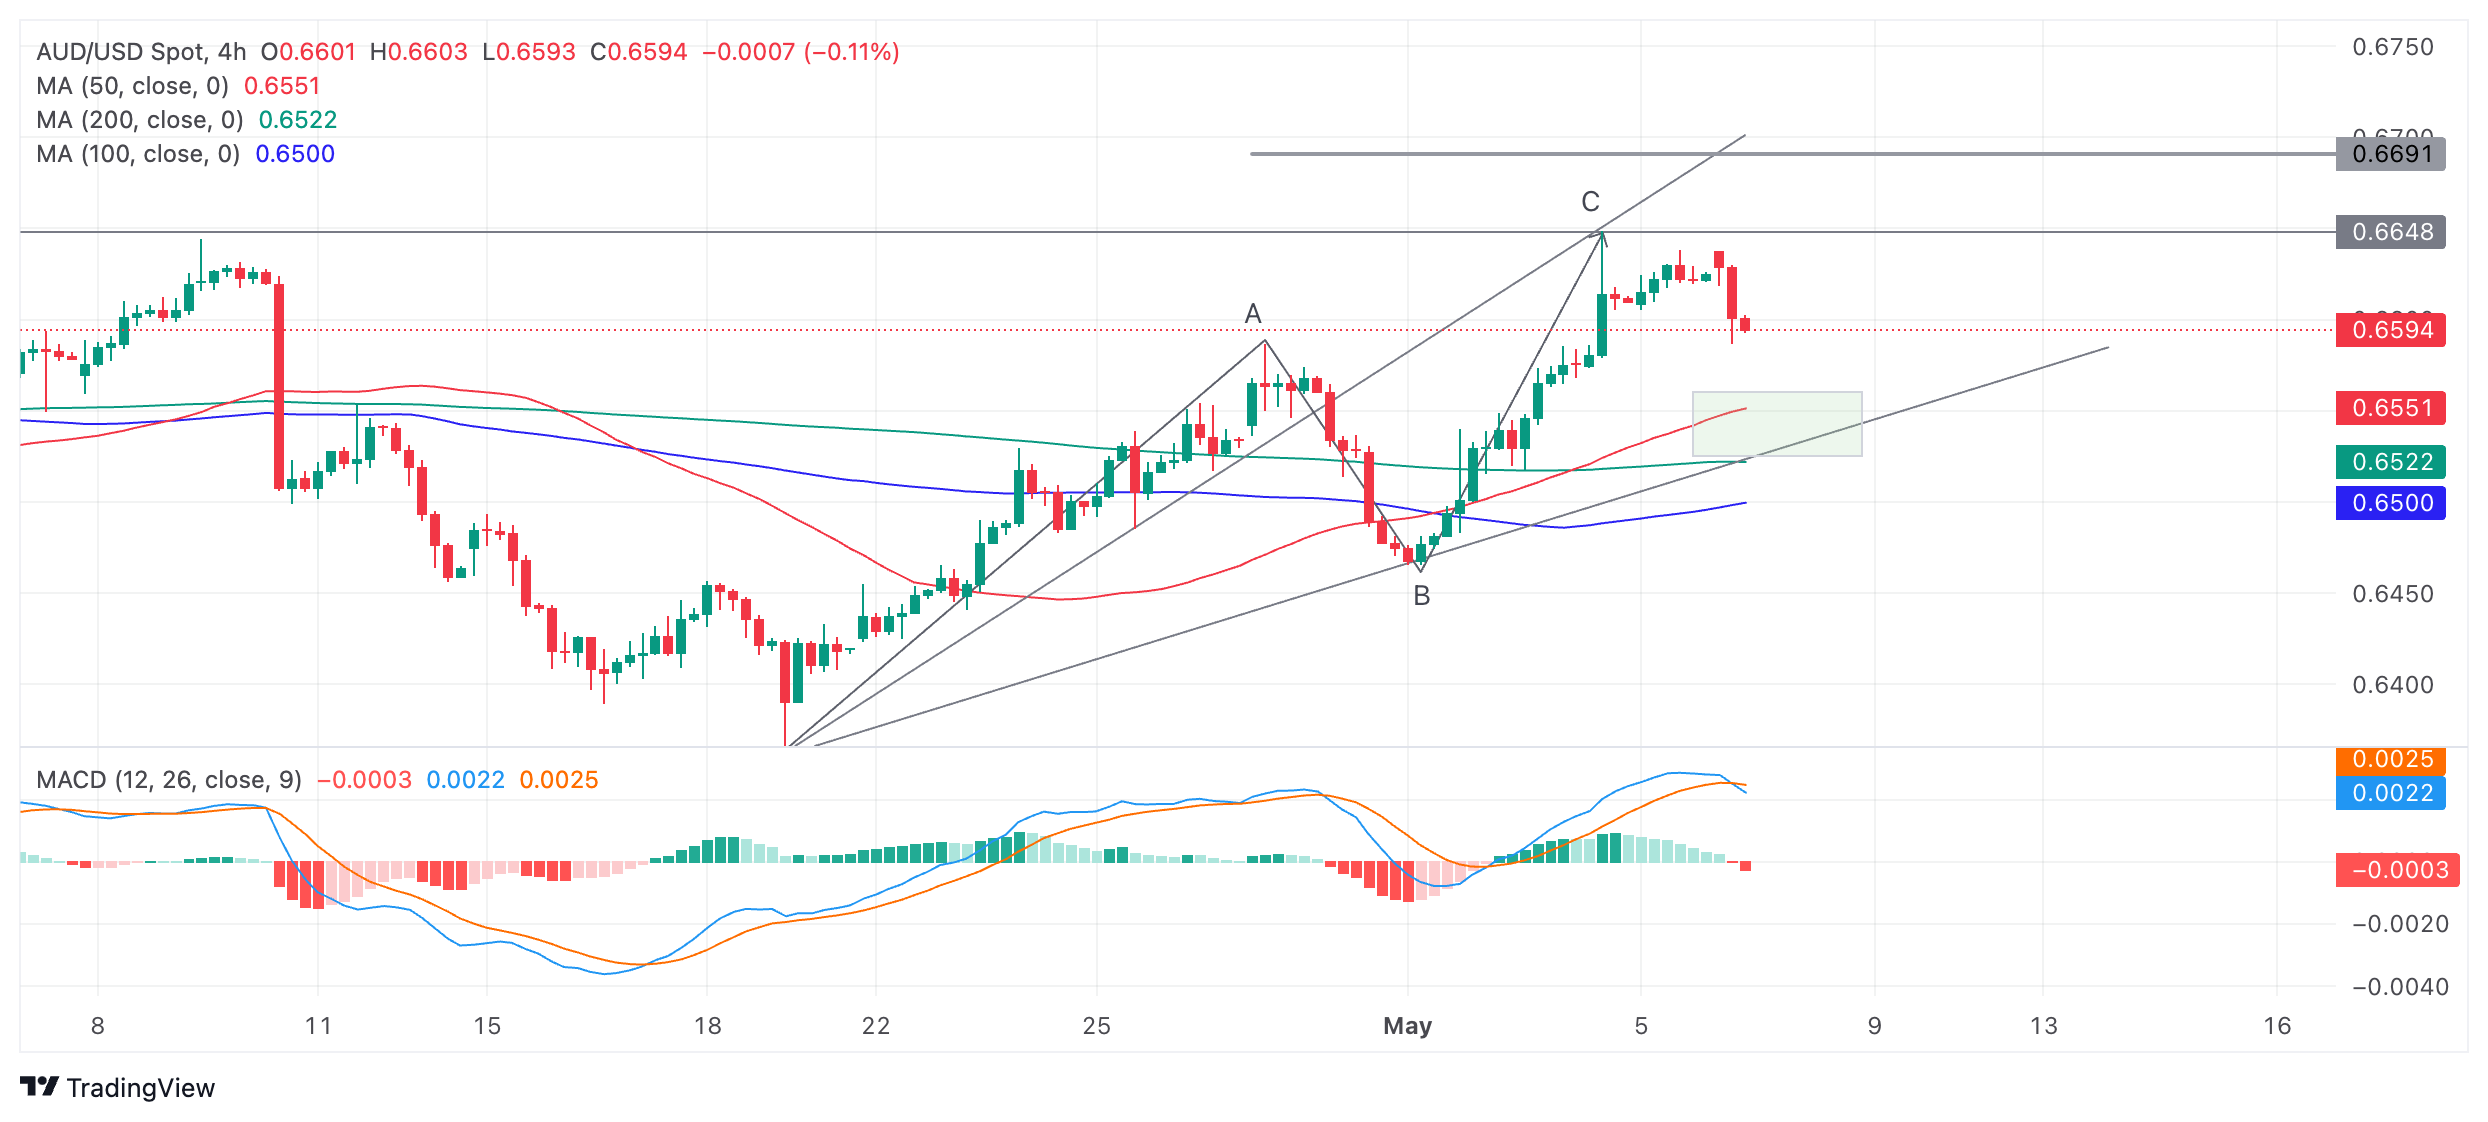
The Moving Average Convergence Divergence (MACD) momentum indicator has crossed below its signal line indicating AUD/USD will probably continue lower for a bit longer. 

The correction could unfold down to support in the rectangular pale green zone drawn on the chart just above the lower trendline. From there price will probably resume its uptrend. A break below the trendline, would be a bearish sign, suggesting a potential reversal. 

If the uptrend resumes it will probably rise back up to the 0.6649 resistance level of the May 3 high, then a target at around 0.6680. 

AUD/USD has probably formed a Measured Move price pattern since the April 19 lows. These patterns are like large zig-zags composed of three waves. These are labeled A, B and C on the chart. The general expectation is that wave C will be either the same length as A or a Fibonacci 0.681 of A. 

Wave C has already reached the Fibonacci 0.681 target of the Measured Move at the May 3 highs, however, there is a chance it could go all the way to the second target where C=A at 0.6680. 

Author

Joaquin Monfort

Joaquin Monfort is a financial writer and analyst with over 10 years experience writing about financial markets and alt data. He holds a degree in Anthropology from London University and a Diploma in Technical analysis.

More from Joaquin Monfort
Share:

Editor's Picks

AUD/USD eyes 0.7150 barrier nine-day EMA

AUD/USD inches higher after registering modest losses in the previous day, trading around 0.7130 during the Asian hours. The technical analysis of the daily chart indicates that the pair is moving sideways within the rectangle pattern, suggesting a consolidation as neither the bulls nor the bears have enough momentum to take control of the market.

USD/JPY trades below 160.00 intervention threshold; bullish bias intact

The USD/JPY pair attracts some sellers during the Asian session amid fears that authorities will step in again to prop up the Japanese Yen. Furthermore, the Israel-Lebanon truce prompts some profit-taking around the US Dollar and exerts downward pressure on the currency pair.

Gold defends 200-day SMA at $4,425, but for how long?

Gold is attempting a tepid recovery toward $4,500 early Thursday, as renewed optimism in the Mideast geopolitical front calms market nerves. This cautious optimism across Asian markets weighs on Oil prices, and diminishes the US Dollar’s safe-haven appeal, helping Gold stage a decent comeback from the weekly low of $4,424.


Hyperliquid: ETF demand, capital rotation fuel HYPE rally as Bitcoin melts

Hyperliquid price sustains an upward trend near its all-time high of $75.76 on Thursday after posting 80% gains in May, while Bitcoin (BTC) retraces below $65,000, triggering a market-wide panic.

Kevin Warsh takes the Fed helm: What it means for the US Dollar
The Federal Reserve moves away from the highly predictable "forward guidance" model of the Jerome Powell era to a new “Kevin Warsh environment”, characterized by less communication, more policy surprises, and an increased focus on the Fed's complex balance sheet.
Recession on paper: What really moves the Canadian Loonie now?

Statistics Canada handed the headline writers a gift and the analysts a headache. Real GDP shrank 0.1% on an annualized basis in the first quarter, and with the fourth quarter of 2025 revised down to a 1.0% contraction, that is two negative quarters in a row, the textbook definition of a technical recession and Canada's first since the pandemic.