|

AUD/USD Price Analysis: Prepares for an impulsive rally, 0.6400 a key hurdle

  • Aussie bulls are aiming to refresh three weeks’ high above 0.6410.
  • The asset is completely out of the woods after a two-week range breakout.
  • The RSI (14) has shifted into the bullish range of 60.00-80.00.

The AUD/USD pair has displayed topsy-turvy moves in a range of 0.6372-0.6400 in the Tokyo session. The asset is hovering around intraday’s high as the US dollar index (DXY) has slipped again below the 111.00 mark.

Meanwhile, risk impulse is mixed as S&P500 futures have witnessed losses in morning trade after a three-day buying spell. The 10-year US Treasury yields have slipped further to 4.09%.

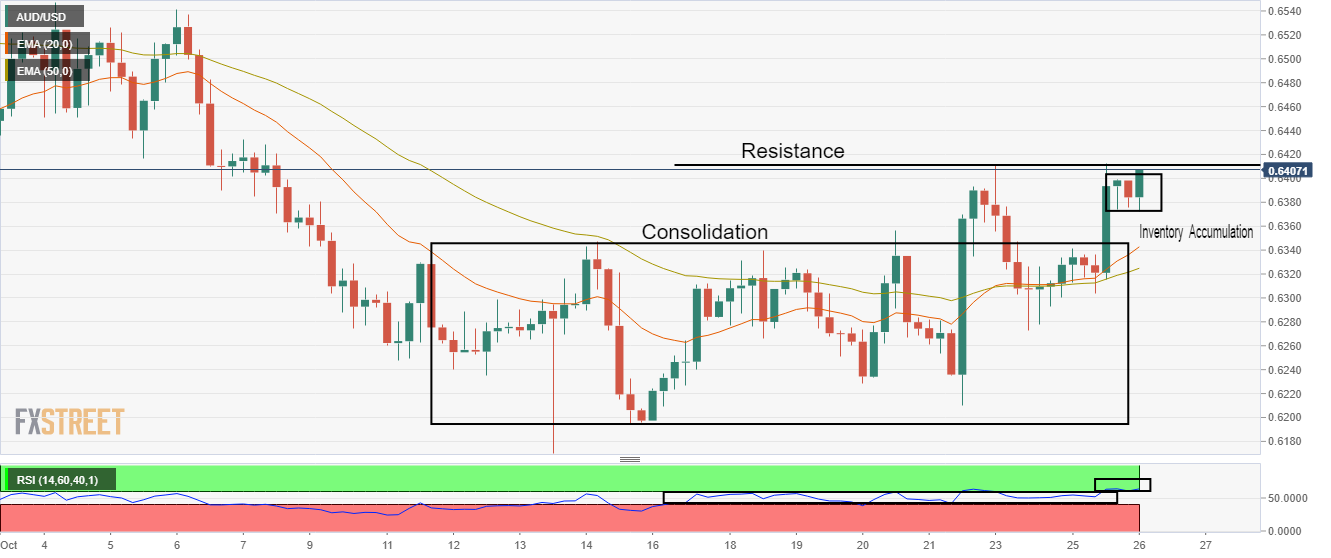
On a four-hour scale, the asset is completely out of the woods after a breakout of the consolidation formed in a two-week range of 0.6200-0.6356. The major is hovering around the immediate hurdle of 0.6411 recorded on Monday. A small consolidation near weekly highs is acting as an inventory accumulation phase before an impulsive rally.

The 20-and 50-period Exponential Moving Averages (EMAs) at 0.6343 and 0.6325 respectively are advancing, which indicates that the trend has shifted towards the north.

Also, the Relative Strength Index (RSI) (14) has shifted into the bullish range of 60.00-80.00, which indicates more gains ahead.

Going forward, a decisive break above Monday’s high at 0.6411 will strengthen the aussie bulls. This will drive the asset towards October 4 low at 0.6451, followed by October 4 high at 0.6548.

On the flip side, a downside break of Thursday’s low at 0.6229 will drag the asset toward the fresh two-year low at 0.6170 and April 2020 low at 0.5991.

AUD/USD four-hour chart

AUD/USD

Overview
Today last price0.6401
Today Daily Change0.0005
Today Daily Change %0.08
Today daily open0.6396
 
Trends
Daily SMA200.6364
Daily SMA500.6612
Daily SMA1000.6772
Daily SMA2000.7001
 
Levels
Previous Daily High0.6412
Previous Daily Low0.63
Previous Weekly High0.6393
Previous Weekly Low0.6197
Previous Monthly High0.6916
Previous Monthly Low0.6363
Daily Fibonacci 38.2%0.6369
Daily Fibonacci 61.8%0.6343
Daily Pivot Point S10.6327
Daily Pivot Point S20.6257
Daily Pivot Point S30.6215
Daily Pivot Point R10.6439
Daily Pivot Point R20.6481
Daily Pivot Point R30.6551

Author

Sagar Dua

Sagar Dua

FXStreet

Sagar Dua is associated with the financial markets from his college days. Along with pursuing post-graduation in Commerce in 2014, he started his markets training with chart analysis.

More from Sagar Dua
Share:

Markets move fast. We move first.

Orange Juice Newsletter brings you expert driven insights - not headlines. Every day on your inbox.

By subscribing you agree to our Terms and conditions.

Editor's Picks

EUR/USD struggles for direction amid USD gains

EUR/USD is trimming part of its earlier gains, coming under some mild downside pressure near 1.1730 as the US Dollar edges higher. Markets are still digesting the Fed’s latest rate decision, while also looking ahead to more commentary from Fed officials in the sessions ahead.

GBP/USD drops to daily lows near 1.3360

Disappointing UK data weighed on the Sterling towards the end of the week, triggering a pullback in GBP/USD to fresh daily lows near 1.3360. Looking ahead, the next key event across the Channel is the BoE meeting on December 18.

Gold losses momentum, challenges $4,300

Gold now gives away some gains and disputes the key $4,300 zone per troy ounce following earlier multi-week highs. The move is being driven by expectations that the Fed will deliver further rate cuts next year, with the yellow metal climbing despite a firmer Greenback and rising US Treasury yields across the board.

Litecoin Price Forecast: LTC struggles to extend gains, bullish bets at risk

Litecoin (LTC) price steadies above $80 at press time on Friday, following a reversal from the $87 resistance level on Wednesday. Derivatives data suggests a bullish positional buildup while the LTC futures Open Interest declines, flashing a long squeeze risk.

Big week ends with big doubts

The S&P 500 continued to push higher yesterday as the US 2-year yield wavered around the 3.50% mark following a Federal Reserve (Fed) rate cut earlier this week that was ultimately perceived as not that hawkish after all. The cut is especially boosting the non-tech pockets of the market.

Aave Price Forecast: AAVE primed for breakout as bullish signals strengthen

Aave (AAVE) price is trading above $204 at the time of writing on Friday and approaching the upper boundary of its descending parallel channel; a breakout from this structure would favor the bulls.