|

AUD/USD Price Analysis: Pair trims a part of its modest intraday gains, plods near 0.6480

  • AUD/USD trades higher due to upbeat Australia’s Private Capital Expenditure.
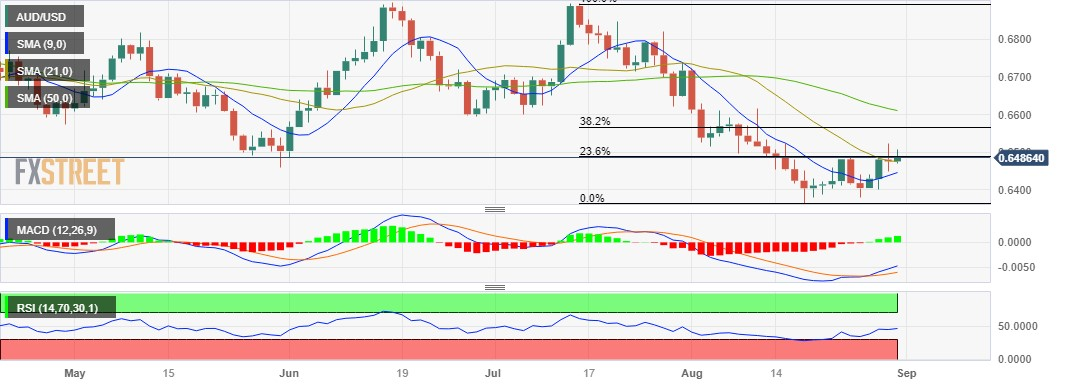
  • 23.6% Fibonacci retracement appears to be a barrier following the three-week high at 0.6522.
  • MACD indicates improvement in the recent momentum but the pair remains bearish as long as stays below the 50-day SMA.

AUD/USD retraces from the previous day’s losses, trading higher around 0.6480 at the time of writing during the Asian session on Thursday. The pair is experiencing upward support due to the downbeat US Treasury yields and disappointing US economic data.

Additionally, Australia’s upbeat Private Capital Expenditure (Q2) was released on Thursday, contributing support to the AUD/USD pair. The data reported that capital expenditure intentions improved to 2.8%, better than the expected 1.2% figure and 2.4% prior.

The 23.6% Fibonacci retracement at 0.6488 emerges as the immediate resistance, followed by the 0.6500 psychological level. A firm break above the latter could support the AUD/USD pair to explore the area around a three-week high at 0.6522, followed by the 38.2% Fibonacci retracement at 0.6565.

On the downside, the pair could meet the key support around the 21-day Simple Moving Average (SMA) at 0.6474, followed by the nine-day SMA at 0.6445. A break below that level could put pressure on the AUD/USD pair to navigate the region around the 0.6400 psychological level.

The 14-day Relative Strength Index (RSI) remains below 50, which suggests a bearish bias of the AUD/USD traders. The Moving Average Convergence Divergence (MACD) line remains below the centerline; however, it indicates a divergence above the signal line. This divergence indicates an improvement in recent momentum.

In the short term, the underlying trend exhibits a bearish outlook as long as the AUD/USD pair stays below the 50-day EMA at 0.6610.

AUD/USD: Daily Chart

AUD/USD: additional important levels

Overview
Today last price0.6482
Today Daily Change0.0007
Today Daily Change %0.11
Today daily open0.6475
 
Trends
Daily SMA200.6474
Daily SMA500.6616
Daily SMA1000.6649
Daily SMA2000.6724
 
Levels
Previous Daily High0.6522
Previous Daily Low0.6449
Previous Weekly High0.6488
Previous Weekly Low0.638
Previous Monthly High0.6895
Previous Monthly Low0.6599
Daily Fibonacci 38.2%0.6477
Daily Fibonacci 61.8%0.6494
Daily Pivot Point S10.6442
Daily Pivot Point S20.6409
Daily Pivot Point S30.6369
Daily Pivot Point R10.6515
Daily Pivot Point R20.6555
Daily Pivot Point R30.6588

Author

Akhtar Faruqui

Akhtar Faruqui is a Forex Analyst based in New Delhi, India. With a keen eye for market trends and a passion for dissecting complex financial dynamics, he is dedicated to delivering accurate and insightful Forex news and analysis.

More from Akhtar Faruqui
Share:

Markets move fast. We move first.

Orange Juice Newsletter brings you expert driven insights - not headlines. Every day on your inbox.

By subscribing you agree to our Terms and conditions.

Editor's Picks

EUR/USD holds steady near 1.1750 on first trading day of 2026

EUR/USD stays calm on Friday and trades in a narrow channel at around 1.1750 as trading conditions remain thin following the New Year holiday and ahead of the weekend. The economic calendar will not feature any high-impact data releases.

GBP/USD struggles to gain traction, stabilizes above 1.3450

After testing 1.3400 on the last day of 2025, GBP/USD managed to stage a rebound. Nevertheless, the pair finds it difficult to gather momentum and moves sideways above 1.3450 as market participants remain in holiday mood.

Gold climbs toward $4,400 following deep correction

Gold reverses its direction and advances toward $4,400 after suffering heavy losses amid profit-taking before the New Year holiday. Growing expectations for a dovish Fed policy and persistent geopolitical risks seem to be helping XAU/USD stretch higher.

Cardano gains early New Year momentum, bulls target falling wedge breakout

Cardano kicks off the New Year on a positive note and is extending gains, trading above $0.36 at the time of writing on Friday. Improving on-chain and derivatives data point to growing bullish interest, while the technical outlook keeps an upside breakout in focus.

Economic outlook 2026-2027 in advanced countries: Solidity test

After a year marked by global economic resilience and ending on a note of optimism, 2026 looks promising and could be a year of solid economic performance. In our baseline scenario, we expect most of the supportive factors at work in 2025 to continue to play a role in 2026.

Crypto market outlook for 2026

Year 2025 was volatile, as crypto often is.  Among positive catalysts were favourable regulatory changes in the U.S., rise of Digital Asset Treasuries (DAT), adoption of AI and tokenization of Real-World-Assets (RWA).