AUD/USD Price Analysis: Further downside eyes 0.7040 support confluence


  • AUD/USD takes the offers to renew daily low, extends pullback from two-week top.
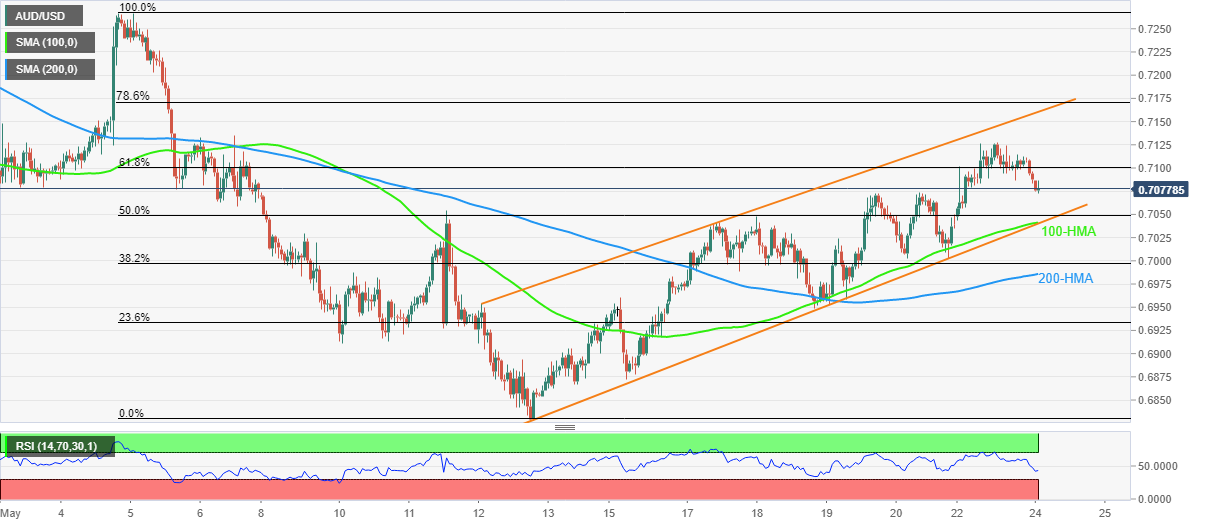
  • 100-HMA, short-term bullish channel’s support lures bears amid downbeat RSI.
  • 200-HMA adds to the downside filters, 61.8% Fibonacci retracement to test recovery moves.

AUD/USD remains on the back foot around the daily low near 0.7080 as it consolidates the previous week’s gains around a fortnight top. Even so, the Aussie pair remains inside a bullish chart formation during Tuesday’s Asian session.

The Aussie pair’s latest weakness could be linked to the inability to stay beyond the 61.8% Fibonacci retracement (Fibo.) of May 05-12 downside, as well as RSI pullback from the overbought territory.

As the RSI and the aforementioned channel both have some downside room before hitting the reversal point, AUD/USD is likely to extend the latest losses.

That said, the lower line of the stated channel and the 100-HMA, around 0.7040, appear a tough nut to crack for the pair sellers.

Also acting as a downside filter is the 0.7000 threshold and the 200-HMA level of 0.6985.

On the flip side, a clear break of the 61.8% Fibo. level, near 0.7100, will recall AUD/USD buyers.

Following that, the latest swing high and the channel’s upper, respectively around 0.7130 and 0.7160, can entertain the bulls before challenging them with the 78.6% Fibonacci retracement level near 0.7170.

AUD/USD: Hourly chart

Trend: Further weakness expected

Additional important levels

Overview
Today last price 0.7082
Today Daily Change -0.0026
Today Daily Change % -0.37%
Today daily open 0.7108
 
Trends
Daily SMA20 0.7039
Daily SMA50 0.7273
Daily SMA100 0.7235
Daily SMA200 0.7261
 
Levels
Previous Daily High 0.7127
Previous Daily Low 0.7044
Previous Weekly High 0.7074
Previous Weekly Low 0.6872
Previous Monthly High 0.7662
Previous Monthly Low 0.7054
Daily Fibonacci 38.2% 0.7096
Daily Fibonacci 61.8% 0.7076
Daily Pivot Point S1 0.7059
Daily Pivot Point S2 0.701
Daily Pivot Point S3 0.6976
Daily Pivot Point R1 0.7143
Daily Pivot Point R2 0.7177
Daily Pivot Point R3 0.7226


Share: Feed news

Information on these pages contains forward-looking statements that involve risks and uncertainties. Markets and instruments profiled on this page are for informational purposes only and should not in any way come across as a recommendation to buy or sell in these assets. You should do your own thorough research before making any investment decisions. FXStreet does not in any way guarantee that this information is free from mistakes, errors, or material misstatements. It also does not guarantee that this information is of a timely nature. Investing in Open Markets involves a great deal of risk, including the loss of all or a portion of your investment, as well as emotional distress. All risks, losses and costs associated with investing, including total loss of principal, are your responsibility. The views and opinions expressed in this article are those of the authors and do not necessarily reflect the official policy or position of FXStreet nor its advertisers. The author will not be held responsible for information that is found at the end of links posted on this page.

If not otherwise explicitly mentioned in the body of the article, at the time of writing, the author has no position in any stock mentioned in this article and no business relationship with any company mentioned. The author has not received compensation for writing this article, other than from FXStreet.

FXStreet and the author do not provide personalized recommendations. The author makes no representations as to the accuracy, completeness, or suitability of this information. FXStreet and the author will not be liable for any errors, omissions or any losses, injuries or damages arising from this information and its display or use. Errors and omissions excepted.

The author and FXStreet are not registered investment advisors and nothing in this article is intended to be investment advice.

Recommended content


Recommended content

Editors’ Picks

EUR/USD edges lower toward 1.0700 post-US PCE

EUR/USD edges lower toward 1.0700 post-US PCE

EUR/USD stays under modest bearish pressure but manages to hold above 1.0700 in the American session on Friday. The US Dollar (USD) gathers strength against its rivals after the stronger-than-forecast PCE inflation data, not allowing the pair to gain traction.

EUR/USD News

GBP/USD retreats to 1.2500 on renewed USD strength

GBP/USD retreats to 1.2500 on renewed USD strength

GBP/USD lost its traction and turned negative on the day near 1.2500. Following the stronger-than-expected PCE inflation readings from the US, the USD stays resilient and makes it difficult for the pair to gather recovery momentum.

GBP/USD News

Gold struggles to hold above $2,350 following US inflation

Gold struggles to hold above $2,350 following US inflation

Gold turned south and declined toward $2,340, erasing a large portion of its daily gains, as the USD benefited from PCE inflation data. The benchmark 10-year US yield, however, stays in negative territory and helps XAU/USD limit its losses. 

Gold News

Bitcoin Weekly Forecast: BTC’s next breakout could propel it to $80,000 Premium

Bitcoin Weekly Forecast: BTC’s next breakout could propel it to $80,000

Bitcoin’s recent price consolidation could be nearing its end as technical indicators and on-chain metrics suggest a potential upward breakout. However, this move would not be straightforward and could punish impatient investors. 

Read more

Week ahead – Hawkish risk as Fed and NFP on tap, Eurozone data eyed too

Week ahead – Hawkish risk as Fed and NFP on tap, Eurozone data eyed too

Fed meets on Wednesday as US inflation stays elevated. Will Friday’s jobs report bring relief or more angst for the markets? Eurozone flash GDP and CPI numbers in focus for the Euro.

Read more

Forex MAJORS

Cryptocurrencies

Signatures