AUD/USD Price Analysis: Finds temporary support near 0.6500


  • AUD/USD finds intermediate support neat 0.6500, more downside remains likely.
  • The US Dollar strengthens as market push back Fed rate cut expectations for June.
  • Australia’s consumer inflation expectations for next 12 months rose to 4.6%.

The AUD/USD pair finds an interim support near the psychological level of 0.6500 in Thursday’s early European session. The Aussie asset is expected to continue the downside move as faded market expectations for the Federal Reserve (Fed) beginning to reduce interest rates in the first half of this year has dampened appetite for risk-sensitive currencies.

S&P 500 futures have posted nominal gains in the Asian session. While the overall market sentiment is downbeat as investors shift focus to the September policy meeting when the Fed could pivot to rate cuts. Prospects for Fed early rate cuts have waned as the United States inflation for March turned out sticky. The US Dollar Index (DXY) jumps to 105.20, approaching five-month high at 106.00.

The US Bureau of Labor Statistics (BLS) reported on Monday that annual and monthly core Consumer Price Index (CPI), which strips of volatile food and energy prices, rose steadily by 3.8% and 0.4%, respectively, suggested that rate cuts are not appropriate currently.

Meanwhile, expectations for the Reserve Bank of Australia (RBA) reducing interest rates sooner have eased due to a significant increase in consumer inflation expectations. The Melbourne Institute reported that inflation expectations for next 12 months accelerated to 4.6% from prior reading of 4.3%.

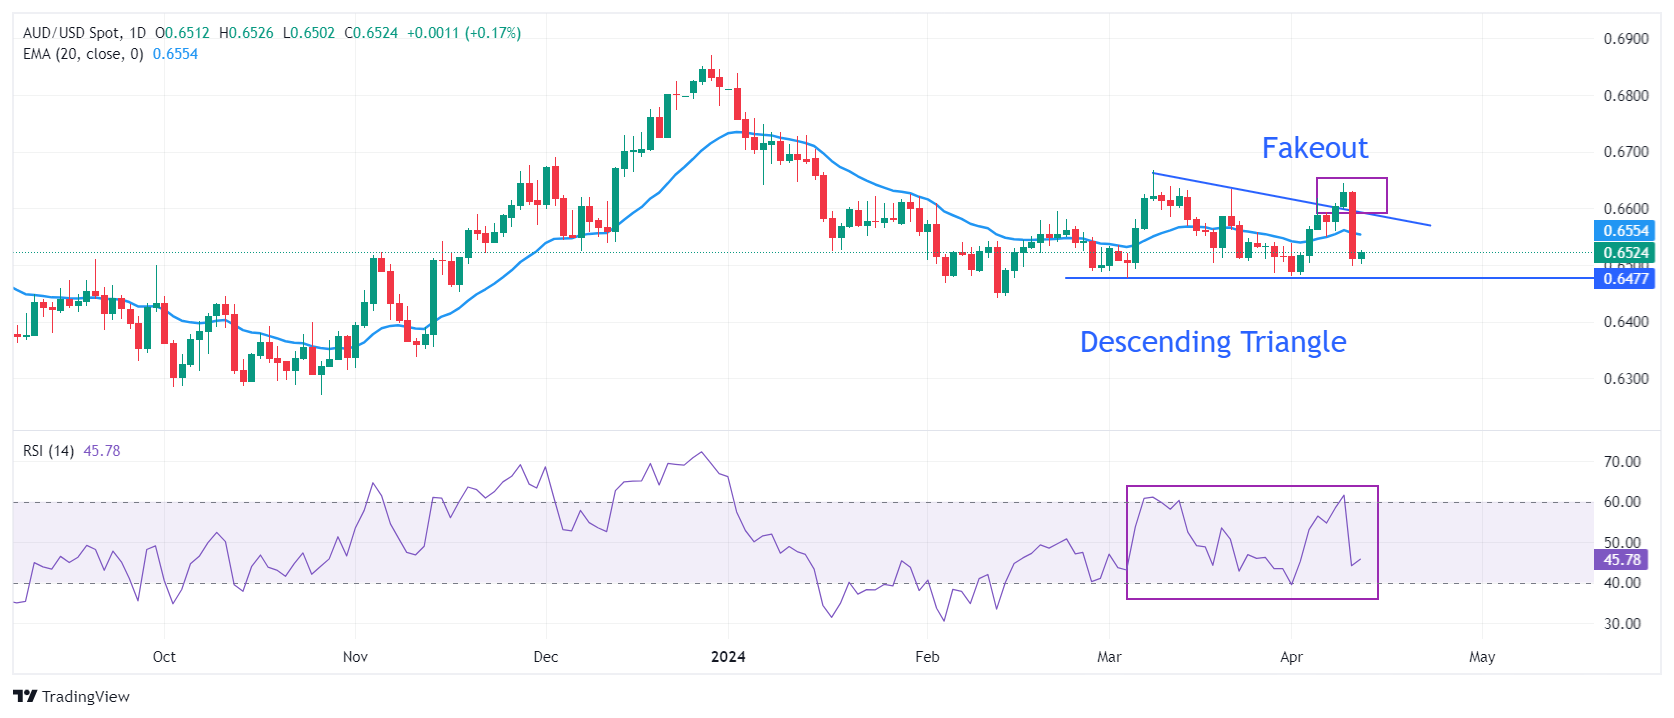
AUD/USD witnesses an intense sell-off after failing to sustain the breakout of the Descending Triangle chart pattern formed on a daily timeframe. The Aussie asset is declining towards the horizontal support of the aforementioned pattern plotted from March 5 low at 0.6477.

The Aussie asset falls below the 20-day Exponential Moving Average (EMA) trading near 0.6550, suggesting weak demand for the Australian Dollar.

The 14-period Relative Strength Index (RSI) falls sharply after failing to climb above 60.00, indicating limited upside.

Investors might build fresh shorts if the asset drops below March 28 low at 0.6485. Profits on shorts would be booked near February 13 low around 0.6440 and the round-level support of 0.6400.

In an alternate scenario, fresh upside would appear if the asset breaks above March 21 high at 0.6635. This will drive the asset toward March 8 high at 0.6667, followed by the round-level resistance of 0.6700.

AUD/USD daily chart

AUD/USD

Overview
Today last price 0.6521
Today Daily Change 0.0009
Today Daily Change % 0.14
Today daily open 0.6512
 
Trends
Daily SMA20 0.6551
Daily SMA50 0.6544
Daily SMA100 0.6603
Daily SMA200 0.6544
 
Levels
Previous Daily High 0.6631
Previous Daily Low 0.6499
Previous Weekly High 0.6619
Previous Weekly Low 0.6481
Previous Monthly High 0.6667
Previous Monthly Low 0.6478
Daily Fibonacci 38.2% 0.6549
Daily Fibonacci 61.8% 0.6581
Daily Pivot Point S1 0.6464
Daily Pivot Point S2 0.6415
Daily Pivot Point S3 0.6331
Daily Pivot Point R1 0.6596
Daily Pivot Point R2 0.668
Daily Pivot Point R3 0.6729


Share: Feed news

Information on these pages contains forward-looking statements that involve risks and uncertainties. Markets and instruments profiled on this page are for informational purposes only and should not in any way come across as a recommendation to buy or sell in these assets. You should do your own thorough research before making any investment decisions. FXStreet does not in any way guarantee that this information is free from mistakes, errors, or material misstatements. It also does not guarantee that this information is of a timely nature. Investing in Open Markets involves a great deal of risk, including the loss of all or a portion of your investment, as well as emotional distress. All risks, losses and costs associated with investing, including total loss of principal, are your responsibility. The views and opinions expressed in this article are those of the authors and do not necessarily reflect the official policy or position of FXStreet nor its advertisers. The author will not be held responsible for information that is found at the end of links posted on this page.

If not otherwise explicitly mentioned in the body of the article, at the time of writing, the author has no position in any stock mentioned in this article and no business relationship with any company mentioned. The author has not received compensation for writing this article, other than from FXStreet.

FXStreet and the author do not provide personalized recommendations. The author makes no representations as to the accuracy, completeness, or suitability of this information. FXStreet and the author will not be liable for any errors, omissions or any losses, injuries or damages arising from this information and its display or use. Errors and omissions excepted.

The author and FXStreet are not registered investment advisors and nothing in this article is intended to be investment advice.

Recommended content


Recommended content

Editors’ Picks

AUD/USD retargets the 0.6600 barrier and above

AUD/USD retargets the 0.6600 barrier and above

AUD/USD extended its positive streak for the sixth session in a row at the beginning of the week, managing to retest the transitory 100-day SMA near 0.6580 on the back of the solid performance of the commodity complex.

AUD/USD News

EUR/USD keeps the bullish bias above 1.0700

EUR/USD keeps the bullish bias above 1.0700

EUR/USD rapidly set aside Friday’s decline and regained strong upside traction in response to the marked retracement in the Greenback following the still-unconfirmed FX intervention by the Japanese MoF.

EUR/USD News

Gold advances for a third consecutive day

Gold advances for a third consecutive day

Gold fluctuates in a relatively tight channel above $2,330 on Monday. The benchmark 10-year US Treasury bond yield corrects lower and helps XAU/USD limit its losses ahead of this week's key Fed policy meeting.

Gold News

Bitcoin price dips to $62K range despite growing international BTC validation via spot ETFs

Bitcoin price dips to $62K range despite growing international BTC validation via spot ETFs

Bitcoin (BTC) price closed down for four weeks in a row, based on the weekly chart, and could be on track for another red candle this week. The last time it did this was in the middle of the bear market when it fell by 42% within a span of nine weeks. 

Read more

Japan intervention: Will it work?

Japan intervention: Will it work?

Dear Japan Intervenes in the Yen for the first time since November 2022 Will it work? Have we seen a top in USDJPY? Let's go through the charts.

Read more

Forex MAJORS

Cryptocurrencies

Signatures