AUD/USD Price Analysis: Eyes a drop towards 0.7450 amid a bear cross
- AUD/USD eyes deeper losses below 0.7500 amid a bear cross on the 1H chart.
- Downside breakout of the falling wedge pattern also backs the bears.
- RSI probes the oversold region, allowing room for more downside.

AUD/USD is extending weakness below 0.7500, trading at the lowest levels in six months, as the US dollar keeps drawing bids on increased safe-haven demand, courtesy of the rising tensions over the Delta covid strain.
Given the discouraging fundamentals, the aussie has breached the falling trendline support on the hourly chart at 0.7481.
An hourly closing below the latter will confirm a downside breakout from a falling wedge formation, opening floors for a test of the psychological 0.7450 support.
The Relative Strength Index (RSI) is probing the oversold territory, currently at 29.59, suggesting that there is some room to the downside.
A bear crossover, represented by the 100- Hourly Moving Average (HMA) having pierced the 200-HMA from above, adds credence to the move lower.
AUD/USD: Hourly chart
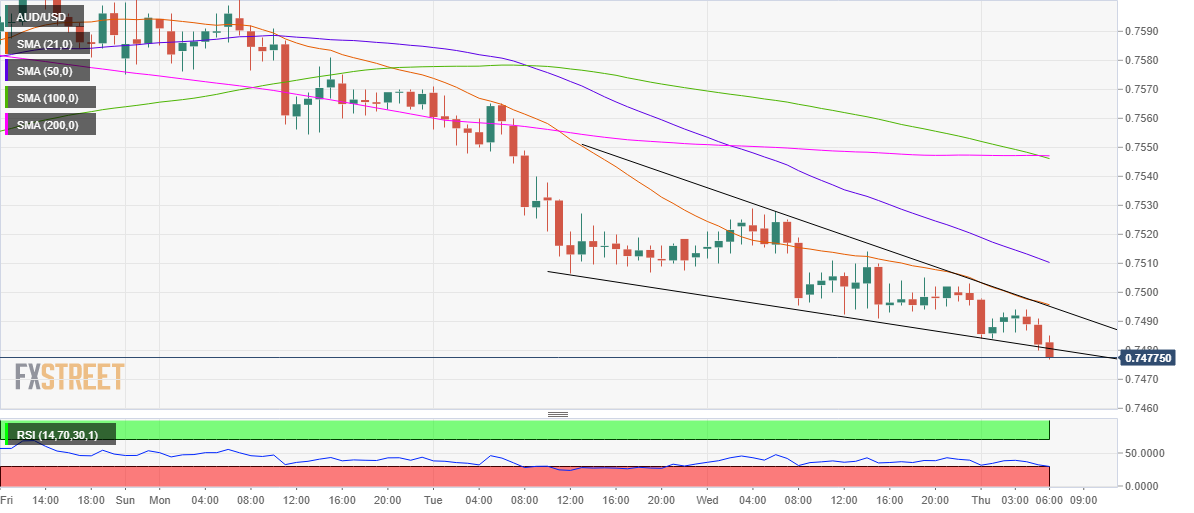
Alternatively, the spot could rebound towards the falling trendline resistance at 0.7495. The bearish 21-HMA coincides at that level.
If the recovery picks up pace, then a test of the downward-sloping 50-HMA at 0.7510 could be well on the cards.
AUD/USD: Additional levels
Author

Dhwani Mehta
FXStreet
Residing in Mumbai (India), Dhwani is a Senior Analyst and Manager of the Asian session at FXStreet. She has over 10 years of experience in analyzing and covering the global financial markets, with specialization in Forex and commodities markets.


